August 28, 2015
The following charts are referenced in an email to TSI subscribers.

The following charts are referenced in an email to TSI subscribers.
Despite the huge differences between gold and all other commodities, gold is still a commodity and its US$ price is still affected by the overall trend in commodity prices. In particular, a major decline in commodity prices will naturally put downward pressure on the gold price and a major advance in commodity prices will naturally put upward pressure on the gold price. That’s why gold’s performance can be most clearly ‘seen’ by comparing it to the performances of other commodities. When this comparison is done it becomes apparent that gold is now very expensive or at least very highly-priced relative to historical levels.
As evidence I present the following chart of the gold/CRB ratio. This chart shows that relative to the basket of commodities represented by the CRB Index, gold has just made a new multi-decade high.
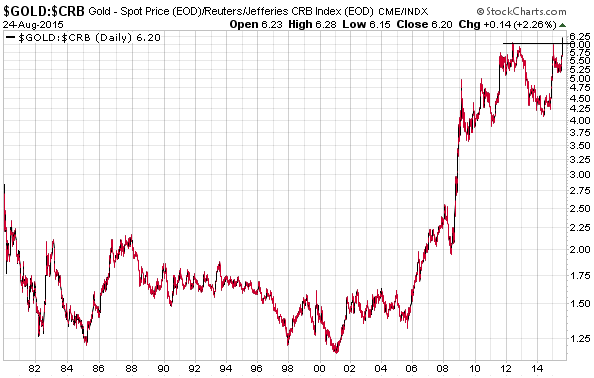
When I look at the above chart I can’t help but think it’s just as well that gold is being manipulated lower, because just imagine how expensive it would otherwise be.
It won’t surprise me if gold moves even higher relative to commodities in general over the coming month in parallel with an on-going flight from risk. Also, I expect the long-term upward trend in the gold/CRB ratio to continue. Lastly, it’s clear that the operators of the great gold-market price-suppression scheme have been doing a lousy job and deserve to be fired for poor performance.
When I say that China’s bubble has burst I’m not referring to the recent large decline in the stock market. Although the stock market was the focal point of Chinese speculation during 2006-2007 and during an 8-month period beginning last October, in the grand scheme of things it is no more than a sideshow. Unfortunately, the stock market crash is a minor issue compared to the main problem.
The main problem is that China’s economy is the scene of a credit bubble of historic proportions. That this is indeed the case is evidenced by the following charts from an article posted by Steve Keen last week.
The first chart shows the ratio of private debt to GDP over the past 30 years for the US (the blue line), Japan (the red line) and China (the black line). In particular, the chart shows that China’s current private-debt/GDP is well above the 30-year high for US private-debt/GDP, which suggests that China’s private-debt bubble is bigger than the US bubble that burst in 2007-2008.

The above chart indicates that China’s private-debt bubble isn’t yet as big as the bubble that popped in Japan in the early-1990s, but the next chart shows that the rate of private-debt growth in China over the past several years is far in excess of anything that happened in either Japan or the US in the years leading up to their respective bubble peaks.
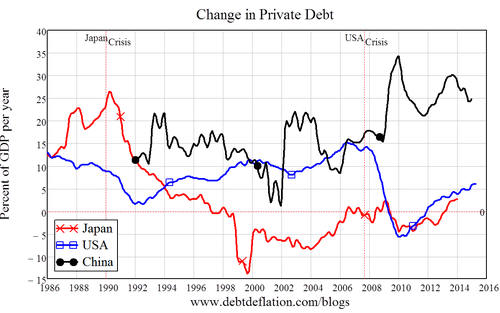
There’s no telling how big a credit bubble will become before it bursts, so the fact that China’s economy is host to one of history’s greatest-ever credit bubbles doesn’t mean that the bubble won’t continue to inflate for years to come. However, there are clues that China has transitioned to the long-term bust phase of the monetary-inflation-fueled boom-bust cycle, that is, there are clues that China’s bubble has burst.
Chief among these clues is the large and accelerating flow of money out of China. So-called “capital outflows” from China have been increasing over the past 12 months and according to a recent Telegraph article amounted to $190B over just the past 7 weeks.
Pressure caused by the flow of “capital” out of China led to the small Yuan devaluation that garnered huge media coverage a couple of weeks ago. In an effort to maintain the semblance of stability, if China’s government had been able to delay the inevitable and keep the Yuan propped-up at an artificially-high level for longer, it would have done so. In other words, the devaluation was a tacit admission by China’s government that the pressure caused by capital outflows had become too great to resist.
Once a private-sector credit bubble begins to unwind, the process is irreversible. The standard Keynesian remedy is to replace private debt with public debt, but all this does is add new distortions to the existing distortions.
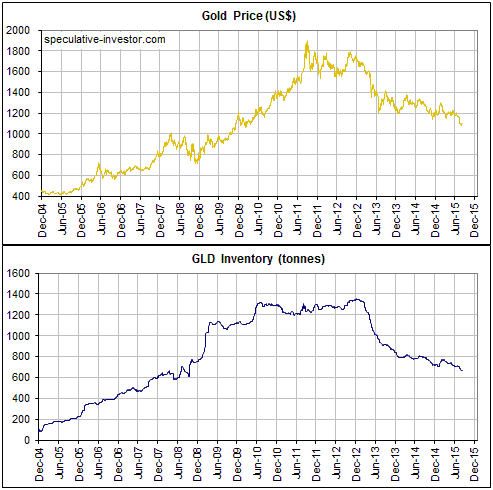
At the end of the week before last the amount of physical gold held by the SPDR Gold Trust (GLD), the largest gold bullion ETF, fell to its lowest level since September-2008. What does this tell us?
In many TSI commentaries over the years and in a couple of posts at the TSI blog over the past year I’ve explained that changes in GLD’s bullion inventory are not directly related to the gold price. Neither a large rise nor a large fall in the gold price would necessarily require a change in GLD’s inventory, the reason being that as a fund that holds nothing other than gold bullion the net asset value (NAV) of a GLD share will naturally move by the same percentage amount as the gold price.
However, there is an indirect relationship between the gold price and GLD’s bullion inventory. At least, there has been such a relationship in the past. I am referring to the long-term correlation between the gold price and the GLD inventory that stems from changes in sentiment.
As traders in GLD shares become more optimistic about gold’s prospects they sometimes buy aggressively enough to push the market price of GLD above its NAV, which prompts an arbitrage trade by Authorised Participants (APs) involving the issuing of new GLD shares and the addition of physical gold to GLD’s inventory. And as traders in GLD shares become more pessimistic about gold’s prospects they sometimes sell aggressively enough to push the market price of GLD below its net asset value (NAV), prompting an arbitrage trade by APs involving the redemption of GLD shares and the removal of physical gold from GLD’s inventory.
That is, changes in GLD’s market price relative to its NAV create opportunities for arbitrage trades that adjust the supply of GLD shares and the amount of physical bullion held by the fund, thus ensuring that the market price never deviates far from the NAV. This modus operandi is common to all ETFs.
Since traders in GLD shares tend to become more optimistic in reaction to a rising price and less optimistic in reaction to a falling price, the most aggressive buying of GLD shares will tend to occur after the gold price has been trending higher for a while and the most aggressive selling of GLD shares will tend to occur after the gold price has been trending lower for a while. This explains why the following chart shows that the long-term correlation between the gold price and the GLD inventory is strongly positive and why the major downward trend in GLD’s inventory began well after the 2011 peak in the gold price.
The upshot is that the price trend is the cause and the GLD inventory is the effect.
In conclusion, here are three implications of the above:
1) Anyone who claims that the gold price has trended lower over the past few years due to the selling of gold from GLD’s inventory is getting cause and effect mixed up.
2) Anyone who claims that gold is being removed from GLD’s inventory to satisfy demand in Asia (or elsewhere) is either clueless about how ETFs work or is telling untruths to promote an agenda.
3) The early-August decline in GLD’s bullion inventory to a new multi-year low was consistent with the price action. It was evidence that GLD traders were getting increasingly bearish in reaction to lower prices. They loved it at $1600-$1900 and they hated it below $1100.