The real interest rate is the nominal interest rate adjusted for the expected change in the associated currency’s purchasing power, where “expected” is the operative word. It is not the nominal interest rate adjusted for the currency’s loss of purchasing power over some prior period.
To further explain, when you buy an interest-bearing security the ‘real’ income that you receive will be determined by the future change in the currency’s purchasing power. For example, the real return from a note that matures in 12 months will be determined by the change in the currency’s purchasing power over the coming 12 months, not the change in the currency’s purchasing power over the preceding 12 months. Of course, when you buy the security you have no way of knowing what will happen to the currency’s purchasing power in the future, but your decision to buy will be based on the nominal yield offered by the security and what you EXPECT to happen to the currency. What happened to the purchasing power of the currency in the past is only relevant to the extent that it affects the expectations of investors.
Consequently, it is not appropriate to estimate the ‘real’ interest rate by subtracting a measure of historical purchasing power loss, such as the percentage change in the CPI over the last 12 months, from the current nominal yield. Doing so would result in a meaningless number even if the CPI were a valid indicator of purchasing-power loss.
A knock-on effect is that the numerous articles and reports that attempt to explain how the price of something responds to changes in the real interest rate, where the real interest rate is calculated by subtracting the change in the CPI over some prior period from the current nominal interest rate, can be put into the “not even wrong” category. They are nonsensical.
Just to be clear, the CPI and similar price indices are inherently flawed indicators of “inflation”, but even if they were good indicators of “inflation” it would make no sense to subtract the historical index change from the present-day nominal interest rate when attempting to estimate the ‘real’ return.
If the main concern is the effects of interest rates and “inflation” on the prices of assets, commodities and gold, then the numbers that matter are today’s nominal interest rates and inflation expectations. In the US these numbers are combined to generate the yields on Treasury Inflation Protected Securities (TIPS), in that the TIPS yield is the nominal yield minus the expected CPI. The TIPS yield is not an accurate indicator of the real interest rate in absolute terms, but it is an accurate indicator of the real interest-rate TREND and whether the real interest rate today is high or low relative to where it was in the past.
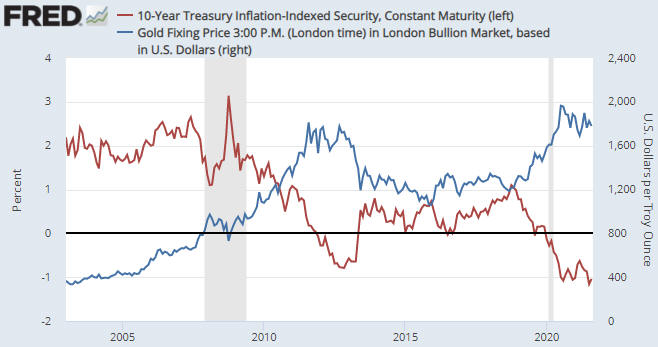
The following chart compares the 10-year TIPS yield with the US$ gold price. A negative correlation is apparent (the trend in the TIPS yield is often the opposite of the trend in the gold price), especially since 2007. The negative correlation doesn’t always apply, though, because the gold price is not determined solely by the real interest rate. There are several other fundamental influences, including credit spreads and the yield curve (the TIPS yield is just one of seven inputs to our Gold True Fundamentals Model).
Treasury Inflation Protected Securities were first issued in 1997 and the Fed’s data used in the above chart doesn’t go back further than 2003, so the TIPS market can’t tell us what happened to real interest rates in the 1970s and 1980s. However, the non-availability of a valid number or methodology is not a good reason to use a bogus number or methodology.
 Print This Post

