We asked and answered the above trick question in a blog post on 22nd March. It’s a trick question because although rising interest rates put downward pressure on some stock market sectors during some periods, they are never the primary cause of major, broad-based stock market declines. After all, the secular equity bull market that began in the early-to-mid 1940s and ended in the mid-to-late 1960s unfolded in parallel with a rising interest-rate trend, and the preceding secular equity bear market unfolded in parallel with a declining interest-rate trend.
As explained in the above-linked post from March-2021, when assessing the prospects of the stock market we should be more concerned about monetary conditions than interest rates. The reason, in a nutshell, is that it isn’t always the case that rising interest rates indicate tightening monetary conditions or that falling interest rates indicate loosening monetary conditions. For example, there was a substantial tightening of monetary conditions in parallel with falling interest rates during 2007-2008.
When attempting to determine the extent to which monetary conditions are tight or loose, one of the most important indicators is the growth rate of the money supply itself.
Rapidly inflating the money supply leads to a period of unsustainable economic vigour called a boom, while a subsequent slowing of the monetary inflation rate leads to a transition from boom to bust. Furthermore, once a boom has been set in motion a subsequent unravelling that eliminates all or most of the superficial progress becomes inevitable. The unravelling can be delayed by maintaining a fast pace of money-supply growth, but doing so will have the effect of making the eventual bust more severe.
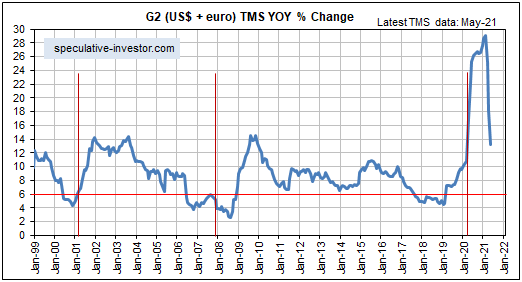
Over the past 25 years, booms have begun to unravel within 12 months of the year-over-year growth rate of G2 (US plus eurozone) True Money Supply (TMS) dropping below 6%. In the typical sequence there is a decline in the G2 monetary inflation rate to below 6%, followed within 12 months by the start of an economic bust (the unravelling of the monetary-inflation-fuelled boom), followed within 12 months by an official recession. Usually, the broad stock market begins to struggle from the time the boom starts to unravel, that is, from the time the G2 monetary inflation rate drops below 6%.
In the above-linked post from March-2021, we concluded:
“…it’s likely that the unravelling of the current boom will begin with the monetary inflation rate at a higher level than in the past. However, with the G2 TMS growth rate well into all-time high territory and still trending upward it is too soon (to put it mildly) to start preparing for an equity bear market.”
It is still too soon to start preparing for an equity bear market (as opposed to a significant correction, which may well be on the cards), but the following chart of the G2 TMS growth rate shows that there has been a dramatic change over the past few months. Based on what has happened and what probably will happen on the monetary front, the conditions could be ripe for the next boom-to-bust transition to begin during the first half of next year.
 Print This Post

