[This blog post is an excerpt from a commentary posted at https://speculative-investor.com/ last week]
In several respects, the past few years have been different from anything in the past. In some cases the reason for the unprecedented outcome is not hard to find. However, while it is always possible to concoct an explanation after the fact, in other cases the reason for the unprecedented outcome remains in doubt.
As an example of an easy-to-find explanation, the fact that the US stock market has become more expensive and more concentrated than ever before is a predictable consequence of the increasing influence of passive investing.
A case where the explanation for the divergence from the historical record is far less clear is the fact that in the US, economic conditions that in the past always were followed by a recession did not lead to a recession. Instead, the economy went from one boom to another with an intervening bust phase that lasted about two years and never became severe enough to qualify as a recession.
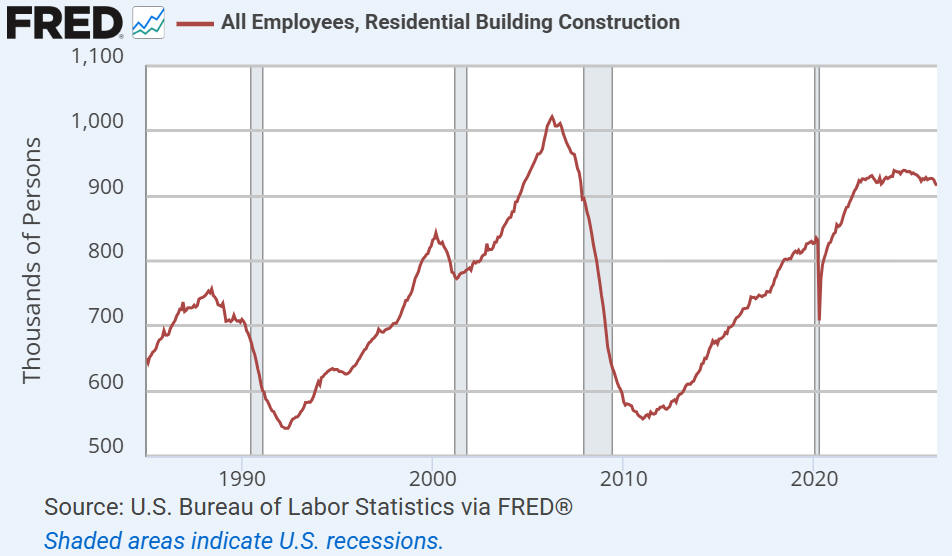
One of the many indicators we can use to make the point that this time has been different is charted below. The chart shows that with the exception of the extremely short COVID recession of 2020, which was caused by the government suddenly shutting down a large portion of the economy, every recession (the shaded areas on the chart) since the start of data collection in 1985 was preceded by a sharp downturn in Residential Construction Payrolls (RCP). Furthermore, prior to 2022 there were no multi-year periods in which RCP essentially went sideways. Consequently, the period from 2022 onwards stands out. For the first time, RCP peaked and instead of dropping spent years going sideways near its cycle high.
After the fact, we can come up with three main reasons why the US economy never became weak enough during 2022-2024 to officially enter recession territory. Here they are:
1) The government spent money (provided fiscal stimulus, that is) as if a recession were underway while the economy was still growing, boosting employment and economic activity in the process. However, this alone could have done no more than delay a recession. In addition, it would have increased the severity of the eventual recession.
2) During 2023-2024, the Fed released about 2.5 trillion dollars into the economy from its Reverse Repo Facility. This meant that during a 2-year period in which the Fed supposedly was tightening monetary conditions, it actually was a net injector of liquidity into the financial markets and the economy. However, like the ‘amped up’ government spending, this could have done no more than delay a recession.
3) The combination of items 1) and 2) potentially could have delayed the start of a recession by 1-2 years, but at around the time that their positive short-term effects on the economy would have ended, the AI-related investment boom became big enough to counteract all other negatives. This wasn’t planned or — as far as we know — foreseen by anybody. For policymakers in the government and the central bank, it constituted blind luck of a very rare kind, because it is unprecedented for a new technology to have such a substantial effect on economy-wide economic statistics within such a short period.
The effect of the AI-reflated investment boom has been positive as far as economy-wide measures of economic activity are concerned, but for many individuals the effects to date have not been positive. In particular, the demand for energy and materials from AI-related spending has increased significantly the cost of living for the average person. Consequently, datacentres have become an important political issue.
“It is different this time” is said to be the most dangerous expression in the world of investing. It usually is a dangerous idea to hold, but the fact is that sometimes it really is different.