Monetary tightening into deflation

October 12, 2022

[This blog post is an excerpt from a recent commentary published at TSI]

It would be difficult for our opinion of Powell and Co. to be any lower, and yet we still manage to overestimate them.

Having correctly anticipated that the Fed had paved the way for a major inflation problem — a problem that would become evident in commodity, goods and services prices rather than just asset prices — during the first half of 2020, we were surprised that the Fed continued to stimulate after such a problem became blatantly obvious in 2021. And over the past few months we have been surprised that the Fed remained on an aggressive monetary tightening path after it became clear that the equity bubble had burst, the US economy had entered or was about to enter recession territory, commodity prices had set intermediate-term peaks and forward-looking indicators of the CPI were in downward trends.

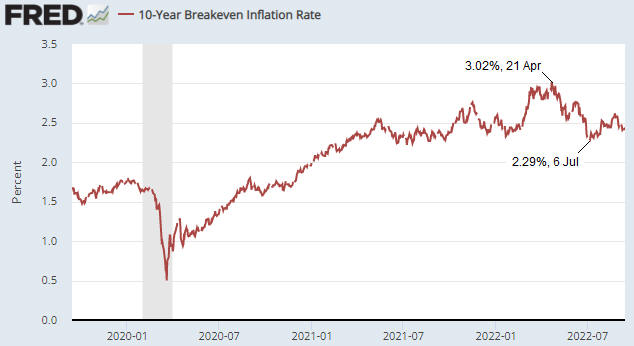
With regard to forward-looking CPI indicators, one of the most useful is the difference between the 10-year T-Note yield and the 10-year TIPS yield, a.k.a. the 10-year Breakeven Rate, which is a measure of the future annual percentage growth of the CPI factored into the bond market. The following chart shows that over the past two weeks this indicator made an 18-month low.


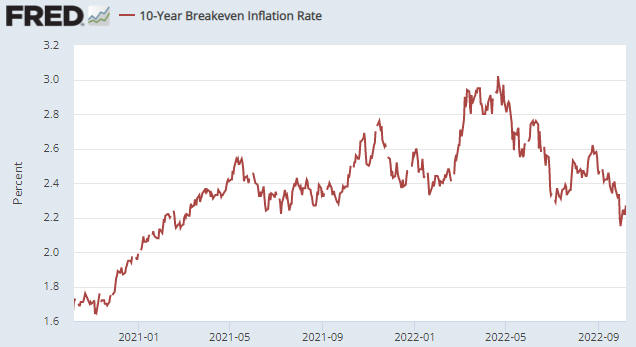
Chart source: https://research.stlouisfed.org/

Another forward-looking CPI indicator is the ISM Manufacturing Prices Paid Index, an index based on a survey of purchasing managers at US manufacturing companies. As illustrated below, this index has plunged over the past six months to its lowest level in more than two years.


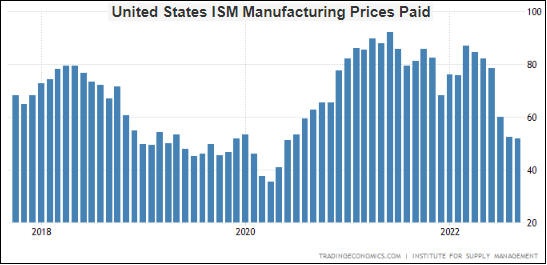
Chart source: https://tradingeconomics.com/

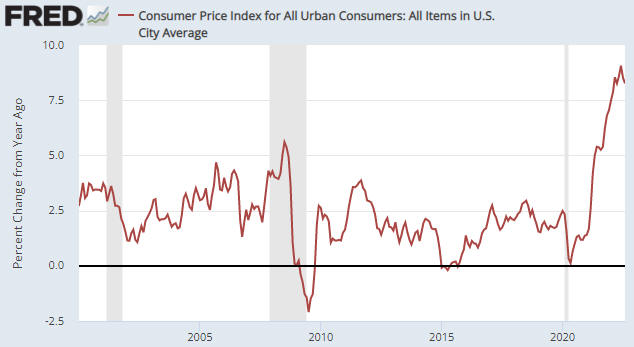
A popular view at the moment is that inflation will prove to be sticky. Well, if the Fed continues along its current path then many people are going to be surprised at just how non-sticky inflation proves to be. We think that if the Fed stays with its current balance-sheet reduction plan until early next year, then by this time next year the year-over-year growth rate of the headline CPI will be less than 2%. It could even be negative.

One of the reasons that the Fed may continue along its current path for a few more months is that policymakers are focusing on the headline CPI growth numbers, and these numbers will remain at very high levels for at least a few more months due to the large price rises that occurred during the first half of this year. Putting it another way, there won’t be a substantial decline in the CPI’s year-over-year growth rate until the large gains that occurred during the first half of this year start dropping out of the calculation. Until then, it’s possible that the Fed will be under political pressure to persist with its “inflation fighting”, and Powell has demonstrated that he is very susceptible to political pressure.

Print This Post Print This Post

Oil and Regime Uncertainty

September 26, 2022

[This blog post is an excerpt from a recent TSI commentary]

Last year US President Biden was telling oil companies that they should be producing less. Then, during the first few months of this year he berated oil companies for not rapidly increasing their production in response to higher prices. Who knows what he will be telling oil companies to do next year or even next week? In this political environment, why would high-profile, publicly-listed oil companies make large investments in long-term oil production growth?

The answer is that they wouldn’t. Even if the next US president understands the need to increase fossil fuel production for at least another 10-15 years and is prepared to stand up to the crowd of misguided environmentalists who seem to believe that renewable energy systems can be created out of nothing, the person that gets the job four years later could have no such understanding and/or no backbone. Therefore, even if the political landscape were to become temporarily supportive, it would be too risky to invest in anything other than small projects with rapid paybacks.

Consequently, we probably have reached “Peak Oil”. This is not the Peak Oil that became a popular story during 2004-2008, because there is no doubt that oil production could be increased with the appropriate investment. It is Peak Oil caused by Regime Uncertainty. As defined HERE, Regime Uncertainty is a pervasive lack of confidence among investors in their ability to foresee the extent to which future government actions will alter their private-property rights.

Due to Regime Uncertainty, we expect that two things will happen over the next few years. The first is that the oil price will make a sustained move above this year’s high (US$130/barrel), because demand will grow (following the 2022-2023 recession) and the oil industry will not respond with large-scale investments in new production. The second is that there will be substantial growth in the amount of wealth returned by oil producers to their shareholders via dividends and share buybacks.

As is the case with NG [natural gas] stocks, short-term weakness in the commodity market combined with downward pressure exerted by the general equity bear market could create excellent opportunities to increase exposure to the oil sector within the next few months.

Print This Post Print This Post

The Inflation Shock

September 20, 2022

[This blog post is an excerpt from a TSI commentary published last week]

The financial markets were shocked — shocked, we tell ya! — by the US CPI for August. We know they were shocked because on the day of the CPI release the US stock market gave back almost all of the gain achieved during the preceding strong 4-day rebound and there was a big up-move in the Dollar Index. Before we take a look at the CPI report that caused the mini panic, it’s worth repeating the following comments from the 15th August Weekly Update:

Over the past few weeks the financial markets have celebrated the signs of declining “inflation”, the thinking being that the evidence of an inflation reversal will lead to a Fed pivot in the short-term. This line of thinking is wrong in two critical ways.

The first way it is wrong is that the Fed’s leadership appears to have its eyes firmly fixed on the rear-view mirror. Although there is now a CPI downtick in the rear-view mirror, base effects (the CPI increases that will remain in the year-over-year calculations for months to come) ensure that the headline CPI growth numbers will remain elevated for at least the remainder of this year. For example, even though inflation most likely has peaked on an intermediate-term basis, the numbers that will stay in and drop out of the year-over-year calculations each month mean that there is almost no chance of the year-over-year CPI growth rate dropping below 6% sooner than the first quarter of next year. In fact, the year-over-year CPI growth rate reported for each of the next three months probably will still have an ‘8 handle’.

Therefore, for months to come the Fed is going to be seeing annual CPI growth rates near multi-decade highs, which will encourage it to continue tightening.

The second way it is wrong is that even after the Fed’s leadership starts to feel confident that inflation is heading towards a level that it deems acceptable, there won’t be an immediate policy reversal.

The evidence continues to accumulate that inflation is now in a downward trend, but due to the price increases that have already occurred it is reasonable to expect that the year-over-year CPI growth numbers will be near multi-decade highs for at least a few more months. Nobody should expect anything else. Certainly, nobody should have been shocked by the 8.3% year-over-year CPI growth number reported for August.

The 8.3% growth rate reported for August followed 8.5% in July and 9.1% in June. This is probably the start of a downward trend that won’t bottom until Q2-Q3 of next year. More significantly, we point out that the percentage change in the CPI over the past two months was approximately zero — the result of a large decline in the gasoline price offset by price gains elsewhere (e.g. in rent and food).

However, the monthly chart displayed below shows that the numbers remain very high relative to everything over the past twenty years prior to the past few months. This is the issue, given the tendency of the Fed’s leadership to fixate on the rear-view mirror.

It’s worth mentioning that there continues to be a wide gap between the current CPI growth rate and the expected future CPI growth rate.

The following daily chart shows that the 10-Year Breakeven Rate, a measure of what the bond market expects the CPI to be in years to come, peaked on 21st April this year at 3.02%, made a short-term bottom at 2.29% on 6th July and currently is much closer to a 12-month low than a 12-month high. There’s a good chance that the expected CPI will drop to 2.0% or lower during the stock market’s next large multi-month decline.

The problem for the stock market bulls who take every hint of declining “inflation” as a reason to anticipate a shift from monetary tightening to monetary easing is that such a shift won’t happen within the next six months unless there is a lot more economic and stock market weakness. We think that the aforementioned monetary shift will happen during the first quarter of next year, but that’s only because we are expecting a lot more weakness in the stock market and the economy.

Print This Post Print This Post

Monetary inflation around the world

September 6, 2022

[This blog post is an excerpt from a recent TSI commentary]

In most countries/regions around the world, monetary inflation rates peaked at extraordinary heights in early 2021 and have since crashed. Furthermore, the declines are set to continue over the next several months as central bankers attempt to make up for their mistake of being far too ‘easy’ during 2020-2021 by being far too ‘tight’ during 2022-2023, thus revealing a fondness for irony given that part of the official justification for central banks is to smooth-out the business cycle. Here are monthly money-supply charts showing where we are and where we’ve been.

G2 True Money Supply (TMS), a concoction of ours that combines the money supplies of the US and the euro-zone, is the primary driver of the global boom-bust cycle. The following chart shows that in July-2022 the year-over-year G2 TMS growth rate dropped below the boom-bust threshold. With both the Fed and the ECB intent on contracting their balance sheets over the months ahead, it’s a virtual certainty that the line on this chart will continue to move downward. This will worsen the global recession that is already underway.

At a little over 10%, Australia’s monetary inflation rate remains high. However, it has come down a lot from its level of 18 months ago and looks set to drop to 5% or lower over the next several months as the Reserve Bank of Australia ‘tightens the screws’. This is bearish for Australia’s real estate market, where valuations generally remain extremely high.

Over the past 18 months Canada’s monetary inflation rate has collapsed from an all-time high to near a multi-decade low. This has very bearish implications for Canada’s real estate market.

The UK’s monetary inflation rate also has collapsed from an all-time high to near a multi-decade low.

Japan has been a monetary inflation enigma for a long time, in that despite the appearance of aggressive Bank of Japan (BOJ) money pumping the year-over-year growth rate of Japan’s M2 money supply spent the bulk of the past 25 years in the 0%-4% range. In response to the COVID crisis the M2 growth rate surged to almost 10% in 2020-2021, but it has since fallen back to its low/narrow multi-decade range.

With regard to money-supply growth, China has been the ‘odd man out’ over the past three years. In China the monetary response to the COVID crisis was relatively minor and by January of this year the year-over-year growth rate of M1 money supply had dropped below zero. It has since rebounded to around 7%.

The following chart shows that China’s monetary inflation rate has been making lower highs and lower lows (trending downward, that is) since 2010. It probably isn’t a fluke that this downward trend coincides with Xi Jinping’s leadership, because Xi does not like financial speculation.

China’s relatively slow rate of monetary inflation over the past few years is a long-term plus for that country’s economy, but it is being counteracted by many negatives including the severe damage that has been wrought by the “Dynamic Zero COVID” policy.

Once central banks have created a bubble the best they can do is step aside and let the markets sort out the mess. Stepping aside would involve not creating any more money and not destroying any existing money. The worst they can do is take money out of the economy, because that causes additional price distortions and because simply ending the pumping-in of new money would be sufficient on its own to burst the bubble. Currently, central banks are doing the worst they can do in an effort to address price rises resulting from supply constraints, as if reducing the availability of money and credit will promote the investment needed to bring about additional supply. These actions will have dire consequences.

Print This Post Print This Post

Money supply confirms the bust

August 31, 2022

[This blog post is an excerpt from a commentary published at TSI last week]

We have referred to the 6% level for the year-over-year US True Money Supply (TMS) growth rate (the US monetary inflation rate) as the boom-bust threshold, because transitions from economic boom to economic bust generally don’t begin until after the TMS growth rate has made a sustained move below this level. It was different this time, however, because according to other indicators the US economy entered the bust phase of the monetary-inflation-driven boom-bust cycle during the first quarter of this year with the TMS growth rate still above 6%. Why was it different this time and what’s the current situation?

We outlined the most likely reasons why it was different this time in previous commentaries, most recently in the 27th July Interim Update. Here’s the relevant excerpt from our 27th July commentary:

We think that the current bust began at a higher rate of monetary inflation than in the past for two main reasons. The first is that the Fed was still in monetary-loosening mode at the peak of the economic boom. This had never happened before and resulted in even greater wastage of real savings/resources than in previous booms. The second reason is that due to decades of increasing central bank manipulation of money and interest rates, the economy has become structurally weaker and therefore the collapse of a boom now requires less relative monetary tightening than in the past.

The main new point we want to make today is that the US money-supply data for July-2022, which were published on Tuesday of this week, reveal that the monetary inflation rate has now confirmed the bust by moving well below the 6% boom-bust threshold. This is illustrated by the first of the two monthly charts displayed below. Furthermore, the second of the following charts shows that the year-over-year TMS growth rate minus the year-over-year percentage change in the Median CPI*, an indicator of the real (inflation-adjusted) change in the US monetary inflation rate, has plunged to near a multi-decade low.

As an aside, from the end of last year to the end of July this year the US True Money Supply increased by $580B. This figure comprises the change in currency in circulation, the change in commercial bank demand and savings deposits, and the change in the amount of money held by the US government in the Treasury General Account (TGA) at the Fed. It is very roughly equal to the increase in commercial bank credit plus the increase in Federal Reserve credit minus the increase in the Fed’s Reverse Repo program. Over the aforementioned period the Fed’s direct actions REDUCED the US money supply by about $210B, but the Fed’s actions were more than offset by the money-creating actions of the commercial banking industry.

With the Fed still on the tightening path, it’s unlikely that the lines on the above charts have bottomed. One implication is that the yield curve probably will become more inverted over the next few months. Another implication is that it would be difficult to be too bearish with regard to the US stock market’s 6-12 month prospects.

*A price index calculated by the Cleveland Fed

Print This Post Print This Post

Monetary Headwinds

August 17, 2022

[This blog post is a brief excerpt from a recent TSI commentary]

Over the past few weeks the financial markets have celebrated the signs of declining “inflation”, the thinking being that the evidence of an inflation reversal will lead to a Fed pivot in the short-term. This line of thinking is wrong in two critical ways.

The first way it is wrong is that the Fed’s leadership appears to have its eyes firmly fixed on the rear-view mirror. Although there is now a CPI downtick in the rear-view mirror, base effects (the CPI increases that will remain in the year-over-year calculations for months to come) ensure that the headline CPI growth numbers will remain elevated for at least the remainder of this year. For example, even though inflation most likely has peaked on an intermediate-term basis, the numbers that will stay in and drop out of the year-over-year calculations each month mean that there is almost no chance of the year-over-year CPI growth rate dropping below 6% sooner than the first quarter of next year. In fact, the year-over-year CPI growth rate reported for each of the next three months probably will still have an ‘8 handle’.

Therefore, for months to come the Fed is going to be seeing annual CPI growth rates near multi-decade highs, which will encourage it to continue tightening.

The second way it is wrong is that even after the Fed’s leadership starts to feel confident that inflation is heading towards a level that it deems acceptable, there won’t be an immediate policy reversal. Instead, the following sequence is likely:

1) The pace of rate hiking will slow

2) The rate hiking will stop

3) The balance sheet contraction (QT) will stop

4) Rate cutting will begin

5) Balance sheet expansion (QE) will begin

At the moment Step 5 is probably at least eight months into the future. In the 2007-2009 bear market and recession, the bear market didn’t end until about six months AFTER step 5.

This suggests to us that asset prices in general and the stock market in particular will face monetary headwinds until at least the first quarter of next year, and that monetary conditions will not be ripe for a new equity bull market any sooner than the second half of next year. In the meantime there will be rebounds to lower highs followed by declines to lower lows.

Print This Post Print This Post

The “inflating away the debt” myth

July 27, 2022

[This blog post is an excerpt from a recent commentary published at TSI]

It is claimed that government indebtedness can be reduced via something called “financial repression”, which is the combination of “price inflation” and interest rate suppression. The idea is that the government debt burden can be made smaller in real terms in a relatively painless way by depreciating the currency in which the debt is denominated while the central bank prevents a large rise in the cost of servicing the debt. At a superficial level it seems plausible and may well be attempted over the years ahead by some governments, including the US government. However, aside from it having never worked as advertised in the past, the problem with financial repression is that when viewed through the lens of good economic theory it is not plausible. On the contrary, good economic theory indicates that the financial repression path leads to the destruction of the currency and economic collapse.

To support their argument, advocates of the idea that financial repression can achieve its intended goal (a reduction in the real government debt burden without dramatically adverse economic consequences) point to the US experience during the decade following the end of the Second World War. During this period there was significant “inflation”, a large reduction in federal government indebtedness and a successful effort by the Fed to prevent the yield on US government bonds from rising to reflect the inflation. However, this is an example of the logical error of observing that ‘B’ followed ‘A’ and concluding that ‘A’ must therefore have caused ‘B’.

In economics there are always many potential influences on an outcome. As a result, to avoid coming up with nonsensical cause-effect relationships you must be armed with prior knowledge in the form of good theory. For example, an observation that over the past twenty years the US unemployment rate has tended to move inversely, with a lag, to the price of beer in Iceland, should not lead to the conclusion that the rate of US unemployment could be reduced by increasing the price of beer in Iceland.

With regard to the US post-War experience, the key to success was not “financial repression”. The keys were the dismantling of New Deal programs, the general freeing-up of the economy, a reduction in government spending (government spending collapsed in the two years immediately after the War and then essentially flat-lined for a few years), and a currency linked to the world’s largest gold reserve. It was the combination of economic strength and restrained government spending, not the combination of inflation and interest-rate suppression, that enabled the US government to greatly reduce its debt burden.

In today’s world, we can safely assume that a general freeing-up of the economy leading to strong real growth is not on the cards.

To envisage what would happen in response to financial repression over the years ahead, bear in mind that if the central bank stops one pressure valve from working then the pressure will blow out somewhere else. For example, by monetising enough government debt the Fed could create a situation involving high price inflation and a low interest expense for the US government, but even in the unlikely event that the US government tried to its rein-in its spending the non-interest-related cost of running the government would surge due to price inflation. As a result, the total amount of government debt would rise rapidly and the Fed would be forced to ramp-up its bond monetisation to keep a lid on government bond yields, causing more “inflation” and giving another substantial boost to the cost of running the government, and so on.

Summing up, in a high-inflation low-growth environment, financial repression would lead to a downward spiral in currency purchasing power and an upward spiral in government indebtedness.

Print This Post Print This Post

Monetary Inflation and Asset Prices

July 7, 2022

[This blog post is an excerpt from a recent TSI commentary]

A basic and very important fact of which hardly anyone is aware is that a general rise in asset prices has nothing to do with economic progress. It is, instead, driven totally by an increase in the supply of money. To put it another way, the general appreciation of asset prices is driven totally by the depreciation of money.

For example, there is no reason other than an increase in the money supply for broad stock market indices to rise over the long-term. The prices of some stocks would rise due to certain companies gaining an advantage and becoming more valuable relative to other companies, but the overall market would not rise in the absence of monetary inflation. An implication is that if the money supply were stable then dividends would constitute 100% of the long-term returns on investment achieved by the owners of broad index funds.

For another example, there is no reason other than an increase in the money supply that residential property prices should rise over the long-term. The prices of some houses would rise due to renovations or zoning changes or some locations increasing in relative popularity, but the median house price would not increase over the long-term in the absence of monetary inflation. In other words, the increase in the median house price is solely due to monetary inflation. This means that if the market value of your house gained 25% over a period and the median house price gained 20% over the same period, then 80% of the increase in the market value of your house was due to the depreciation of money.

A source of confusion is that over the past 50 years asset prices have tended to rise much faster than the prices of goods and services, creating the impression that the price increases are mostly real (that is, not driven by the depreciation of money). This has happened due to the nature of monetary inflation and policies designed to boost the prices of assets.

An important characteristic of monetary inflation is that the new money does not get injected uniformly throughout the economy and therefore does not affect prices in a uniform manner. As explained in a TSI commentary in 2019, this is one of the three reasons that the Quantity Theory of Money (QTM), which holds that the change in the “general price level” is proportional to the change in the money supply, doesn’t work.

Instead of a uniform rise in prices in response to monetary inflation, different prices get affected in different ways at different times depending on who the first receivers of the new money happen to be. In the case where the new money is created by the central bank as part of a QE program, which has happened a lot since 2008, the first receivers of the new money are bond speculators. This makes the owners of financial assets the initial and main beneficiaries of the money creation. In the case where the new money is loaned into existence by commercial banks, the main beneficiaries are the owners of assets that are purchased with the borrowed money. Over the past few decades a sizable portion of the borrowing from commercial banks has been related to the purchase of real estate (most buyers of houses are able to borrow a high percentage of the purchase price), causing the owners of houses to be among the main beneficiaries.

As an aside, monetary inflation is responsible for the widening of the “wealth gap” that has occurred over the past 40 years, because it benefits the asset rich at the expense of the asset poor. The expanding wealth gap is now being touted as the justification for greater government intervention and/or taxation, almost always by people with no understanding of the underlying cause.

As another aside, the big inflation-related change that happened during 2020-2021 is that a large increase in the money supply was accompanied by government actions that simultaneously destroyed supply chains and super-charged consumer spending.

Monetary inflation’s pivotal role in boosting/distorting asset prices is why we pay so much attention to it and so little attention to the more popular ‘fundamentals’. In some cases the more popular fundamentals, market-wide corporate earnings being a good example, are themselves just functions of the monetary inflation rate.

Print This Post Print This Post

Energy Transition Realities

June 24, 2022

[This blog post is an excerpt from a recent commentary published at TSI]

This is a follow-up to our 25th April piece titled “Inconvenient Facts” in which we summarised some of the issues that are ignored or brushed over by many proponents of a fast transition to a world dominated by renewable energy sources. The follow-up was prompted by a recent RealVision.com interview of Wil VanLoh, the CEO of Quantum Energy Partners, by Kyle Bass. The charts displayed below were taken from this interview.

To summarise the summary included in our earlier piece, it takes a lot of energy and minerals to build renewable energy systems and it takes years for a renewable energy system to ‘pay back’ the energy that was used to build it. Consequently, achieving the energy transition goals set by many governments will require increasing production of fossil fuels for at least the next ten years, which, in turn, will require substantially increased investment in fossil fuel production and distribution (pipelines, terminals, storage facilities and ships). In addition, achieving today’s energy transition goals will necessitate substantially increased production of certain minerals, meaning that it will require more mining.

With regard to the need for more mining to bring about the Sustainable Energy Transition (SET), the top section of the following chart compares the quantities of minerals required to build a conventional car with the quantities required to build an electric car. The bottom section of the same chart does a similar comparison of fossil-fuel (natural gas and coal) power generation and renewable (solar, on-shore wind and off-shore wind) power generation.

The next chart illustrates the increase in the production of several minerals that will have to happen by 2030 to achieve the current energy transition goals. Of particular interest to us, it shows that over the next eight years copper and zinc production will have to double, manganese production will have to increase by 5-times, nickel production will have to increase by 11-times and lithium production will have to increase by 18-times.

On a related matter, mining is an energy-intensive process. Moreover, the bulk of the increased mining required to meet the current SET goals will occur in places where the only economically-viable sources of energy will be fossil-fuelled power stations or local diesel-fuelled generation. This means that the increase in mining required for the energy transition will, itself, require increased production of coal, natural gas and diesel.

Soaring prices of oil, natural gas, coal and oil-based products (gasoline and diesel) have focused the attention of senior Western politicians on the urgent need for more oil and natural gas production. However, today’s supply shortages are due to a decade of under-investment in hydrocarbon production, which, in turn, is a) the result of political and social pressure NOT to invest in such production, b) a problem that even in a best-case scenario will take many years to resolve, and c) a problem that will be exacerbated by chastising oil companies and threatening government intervention to cap prices.

If it were possible to do so, ‘greedy’ oil and oil-refining companies would be very happy to flip a switch and increase production to take advantage of current high prices. The reality is that it isn’t possible and that increasing production to a meaningful extent will require large, long-term investments. But why should these companies take the risks associated with major investments to boost long-term supply when they continue to be pressured by both governments and their own shareholders to prioritise reduced carbon emissions above all other considerations and when there is enormous uncertainty regarding future government energy policy?

Print This Post Print This Post

The Fed has been ‘quantitatively tightening’ for more than 6 months

June 15, 2022

[This blog post is a excerpt from a recent TSI commentary]

In terms of effect on the money supply, reverse repurchase agreements (reverse repos) are the opposite of quantitative easing (QE). Whereas every dollar of QE adds one dollar to the money supply plus one dollar to bank reserves at the Fed (bank reserves are not counted in the money supply), every dollar of reverse repos subtracts one dollar from the money supply plus one dollar from bank reserves at the Fed. Consequently, although reverse repos are not done with the primary aim of tightening monetary conditions, they effectively are a form of quantitative tightening (QT).

Unlike QE, reverse repos are temporary. To be more specific, the money removed from the banking system via a reverse repo will be returned within 24 hours unless a new reverse repo is created to replace the expiring one. However, the following chart shows that since April of last year the Fed has not only been rolling over or replacing expired reverse repos, but also has been adding to the outstanding pile by creating new reverse repos. As a result, the outstanding pile of reverse repos now amounts to $2.16 trillion. This means that the Fed’s reverse repo program has removed $2.16 trillion from the US economy since the beginning of April-2021.

From April-2021 until March-2022 the Fed was adding money to the economy via QE and simultaneously removing money from the economy via reverse repos. The amount of money being added via QE was greater than or equal to the amount being subtracted via reverse repos until early-December of last year, at which time the Fed became a net subtractor from the US money supply and US bank reserves.

One implication is that even though the Fed officially won’t start QT until this month, for all intents and purposes QT has been happening for about six months. Another implication is that the Fed now has more than two trillion dollars that it could inject into the economy simply by allowing existing reverse repos to expire. This could enable the Fed to boost the money supply over the months ahead while pretending to do QT.

Print This Post Print This Post