US Recession Watch

June 5, 2023

[This blog post is an excerpt from a recent commentary published at speculative-investor.com]

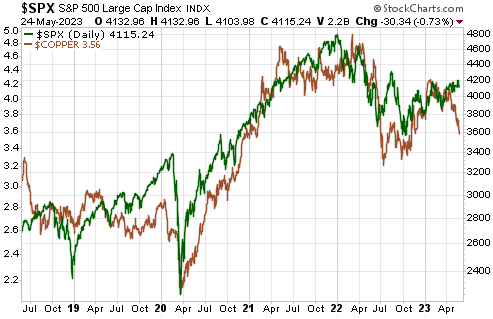
Leading indicators of the US economy continue to signal imminent recession, but coincident indicators are mixed and some lagging indicators, most notably employment, are still showing strength. Therefore, it isn’t clear whether or not a recession has commenced. Also, high-profile parts of the stock market are muddying the water by trading as if a “soft landing” (no recession, but a large-enough inflation decline to cause the Fed to reverse course) were the most likely economic outcome over the next several months.

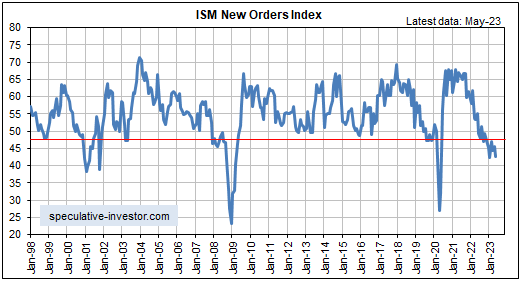
Turning to our favourite two leading indicators, first up we have a chart showing that the ISM Manufacturing New Orders Index (NOI) made its cycle low to date in January-2023 and returned to its cycle low in May-2023. As noted in previous TSI commentaries, at no time since 1970 has the ISM Manufacturing NOI been as low as it is today without the US economy being either in recession or about to enter recession.

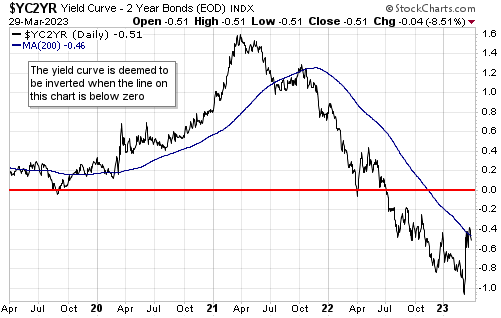
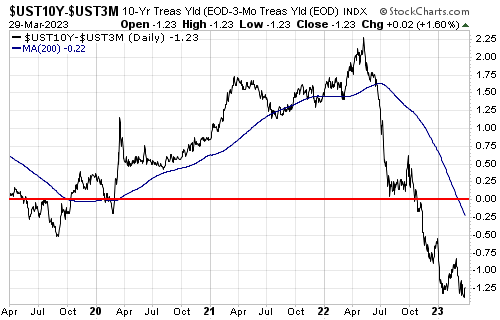
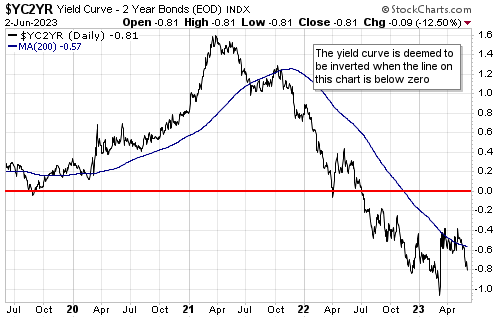
Next up is the yield curve, which remains inverted to an extreme. The extreme inversion tells us that monetary conditions have become tight enough to virtually guarantee an official recession, but the signal that a recession is imminent is a reversal of the yield curve from flattening/inverting to steepening.

A yield curve reversal from flattening/inverting to steepening has not happened, yet. It’s possible that the rebound in the 10-year T-Note yield minus the 2-year T-Note yield (the 10y-2y spread) from its March-2023 low is the start of a reversal, but the 10-year T-Note yield minus the 3-month T-Note yield (the 10y-3m spread), an equally important measure of the yield curve, just hit a new inversion extreme for the cycle. Daily charts of these interest rate spreads are displayed below.

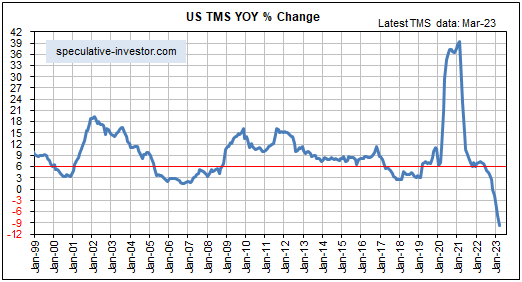
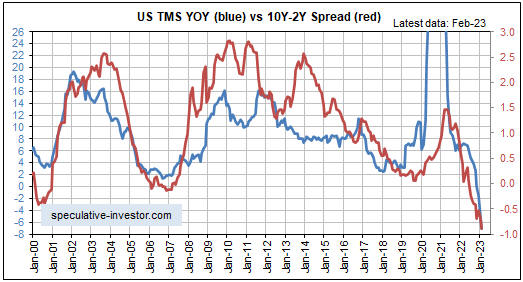
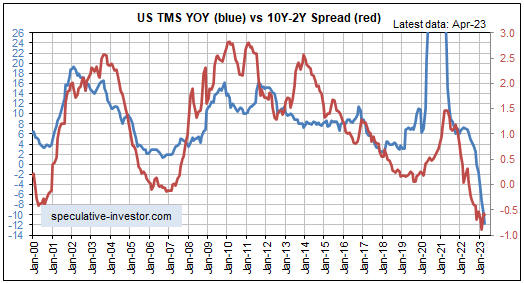
As explained in the past, the yield curve is driven by the monetary inflation rate and tends to lag the monetary inflation rate at major turning points. Of particular relevance at this time, a reversal in the yield curve from flattening/inverting to steepening usually follows a major upward reversal in the monetary inflation rate. This relationship is illustrated by the monthly chart displayed below. The red line on this chart is the 10y-2y spread and the blue line is the growth rate of US True Money Supply (TMS).

Clearly, the monetary inflation rate has not yet reversed upward. This indicates that the monetary conditions for a yield curve reversal are not yet in place.

Note that for the monetary inflation rate to begin trending upward in the near future, a large amount of money probably will have to exit the Fed’s Reverse Repo facility. This could happen in response to the flood of new debt that will be issued by the Treasury within the next couple of months.

In conclusion, it’s possible that a US economic recession has begun, but it’s now more likely that a recession won’t begin until the third quarter of this year.

Print This Post Print This Post

The stock market says one thing, the copper market says another

May 30, 2023

[This blog post is an excerpt for a commentary published last week at www.speculative-investor.com]

The following chart shows that over the past five years the US$ copper price (the brown line) and the S&P500 Index (the green line) generally trended in the same direction. Why, then, have they moved in opposite directions over the past two months?

The relationship between the copper price and the S&P500 Index (SPX) can be described as one of generally positive correlation with divergent movements at times. The copper price acts as an economic bellwether due to its extensive industrial usage, while the SPX represents general equity market sentiment. They are influenced by similar macroeconomic factors, but short-term performance differences occasionally arise due to shifts in commodity-specific factors, inflation expectations and risk preferences.

The performance difference since early-April, with the copper price moving downward to a new low for the year while the SPX moved upward to a new high for the year, is most likely due to shifting risk preferences within the stock market. To be more specific, the copper price has declined in sympathy with a global manufacturing recession (the US, European and Chinese manufacturing PMIs are all in recession territory) and the high probability of reduced metal demand over the months ahead as the on-going monetary tightening takes its inevitable economic toll, while the SPX has risen on the back of speculation that technology in general and AI in particular will generate good returns almost regardless of what happens to the economy.

One way or the other, it’s likely that the divergence will close within the next three months.

From our perspective, copper is performing exactly the way it should be performing considering the macroeconomic landscape. It is short-term oversold and could rebound at any time (a routine countertrend rebound would take the copper price back to the US$3.80s), but we suspect that it will trade at least 10% below its current price before completing its downward trend. Consequently, we expect that the divergence will close via weakness in the stock market rather than strength in the copper market.

Print This Post Print This Post

Debt Ceiling Scenarios

May 23, 2023

[This blog post is an excerpt from a recent commentary at https://speculative-investor.com/]

Last week there was a big drop in the US federal government’s account at the Fed (the Treasury General Account, or TGA for short). The latest figures show a TGA balance of only US$57B, which probably means that the government will run out of money within the next three weeks unless a deal is done to raise or suspend the Debt Ceiling. Given the lack of fear recently evident in the financial markets, with risk-off assets such as gold doing relatively poorly and signs of aggressive bullish speculation in parts of the stock market, it appears that most market participants expect a deal to be done very soon. While that’s definitely possible, it’s far from a foregone conclusion. Moreover, what comes after a Debt Ceiling deal will not favour the stock market.

What comes after a Debt Ceiling deal will be a flood of new government debt issuance to replenish the TGA and make the payments that were postponed during the preceding months. To be more specific, based on information provided by the Treasury there will be net new debt issuance of more than US$700B during the three months following a deal. This will drain liquidity from the financial markets unless it is accompanied by money leaving the Fed’s Reverse Repo (RRP) program. For instance, if the government were to increase its total debt by $750B after a deal and $500B of the new debt were purchased by MMFs using funds presently held in the RRP program, then the net liquidity drain would only amount to $250B.

Currently, therefore, there are two big unknowns. The first is the timing of a political deal to raise the Debt Ceiling and the second is the proportion of the ensuing flood of new debt that will be offset — in terms of effect on financial market liquidity — by money coming out of RRPs.

With regard to the timing question, there are two main scenarios.

The first is that a deal will be done within the next three weeks, thus avoiding a partial shutdown of the government. As mentioned above, this currently appears to be the general expectation. We suspect that if it comes to pass it will lead to short-lived (1 week maximum) moves to the upside in the stock market and downside in the gold and T-Bond markets, followed by reversals as other issues, including an imminent recession and the coming flood of new government debt, move to centre-stage.

The second scenario is that the political negotiations will drag on until a deal is forced upon the two negotiating parties by extreme weakness in the stock market. Under this scenario, a deal could be 2-3 months away. Even though the TGA balance probably will drop to almost zero within three weeks, this sort of delay in striking a deal is possible because of the corporate tax payments that are due on 15th June and the additional special measures that could become available to the Treasury at the end of June. In addition to substantial stock market weakness and a partial government shutdown, likely ramifications of this scenario include a large rise in the gold price.

What happens with the US government’s Debt Ceiling will have a big influence on the paths taken by the major financial markets over the next three months, but our short-term assessments of risk and reward do not hinge on when/how the Debt Ceiling issue is resolved. Regardless of whether we get the first scenario or the second scenario or something in between, the outlook for the next three months is bearish for the S&P500 Index, bullish for gold and bullish for the T-Bond.

Print This Post Print This Post

An important gold mining cycle

May 17, 2023

[This blog post is an excerpt from a recent commentary at https://speculative-investor.com/]

Short-term moves can create opportunities to scale in or scale out, but the big picture always should be kept in mind. For the gold mining sector, this means keeping in mind the high probability that a cyclical bull market is underway. This cyclical trend should result in large additional gains by gold mining stocks in nominal terms and relative to most other stocks. With regard to relative performance, the following two weekly charts give some idea as to the amount by which gold mining stocks could outperform other commodity-related stocks over the next 6-12 months.

The first chart shows that gold mining stocks (represented by GDX) doubled-bottomed relative to general mining stocks (represented by XME) between August of last year and February of this year. Significant gains in the GDX/XME ratio have occurred already, but based on the historical record the ratio could double from here prior to making its next major peak. As mentioned in previous TSI commentaries, the cyclicality of this ratio points to the gold sector’s next major relative-strength peak occurring between late-2023 and mid-2024.

The second chart shows that the gold sector reversed upward relative to the oil sector (represented by XLE) during the final quarter of last year. This chart suggests that the new trend involving strength in gold stocks relative to oil stocks is still in its infancy.

In case what we’ve written above and in many previous commentaries is not clear, the focus of most investing/speculating should be on gold and the related assets (silver and the gold/silver mining stocks). This has been the case for the past six months, it is the case now and it likely will be the case for the next six months.

For equity traders, this means that the gold mining sector should be prioritised when planning portfolio additions. However, it doesn’t mean that everything else should be ignored and that your entire portfolio should consist of gold/silver stocks. With regard to “everything else”, we note that the fundamentals for the oil tanker sector remain very bullish, the cannabis sector is starting to shows signs of life, it is important to have exposure to energy (oil, coal, uranium and natural gas) and it would make sense to have some exposure to commodities such as lithium and the REEs.

Print This Post Print This Post

Can the government create wealth by going into debt?

May 3, 2023

Some economists/analysts argue that the government creates wealth in the private sector via deficit-spending. From an accounting perspective they are right, in that when the government borrows and then spends X$ the private sector is left with the same amount of dollars plus an asset in the form of government debt securities worth X$. This implies that every dollar of government deficit-spending immediately adds a dollar to the private sector’s wealth, regardless of whether or not the spending contributes to the pool of real resources. This is counterintuitive. After all, given that every government is very good at deficit spending, there would be no poverty in the world if it really were possible for the government to create wealth in the private sector simply by putting itself further into debt. So, what’s the problem with the aforementioned accounting?

There are multiple problems, the first of which I’ll explain via a hypothetical case. Fred Smith is operating a basic Ponzi scheme. He is issuing $1,000 bonds that have a very attractive yield and using money from new investors to pay the interest on existing bonds and to finance a lavish lifestyle for himself. Using the same accounting that was used above to ‘explain’ how government deficit-spending creates wealth, every time Fred issues a new bond and spends the proceeds the total amount of wealth in the economy ex-Fred increases by $1,000.

The government is like Fred. For all intents and purposes, the government is running a Ponzi scheme because a) the interest and principal payments to existing investors are financed by issuing new debt, and b) there is no intent to ever pay-off the debt (the total debt increases every year). As was the case in the Fred example, every time the government issues a new bond and spends the proceeds the total amount of wealth in the economy ex-government increases by the amount paid for the bond.

Just as it would not make sense to view a dollar invested in Fred’s Ponzi scheme as having the equivalent effect on actual wealth as a dollar invested productively, it does not make sense to equate investment in government bonds with investment in productive assets.

That’s not the only problem, because if government bonds are purchased with existing money then an increase in government indebtedness must result in reduced investment in private sector debt or equity. In this case, therefore, government deficit-spending ‘crowds out’ private-sector investment, which is a problem in that politically-motivated spending by the government is likely to contribute less to the total pool of real wealth than economically-motivated spending by the private sector.

But what if government debt is purchased by the central bank or commercial banks with newly-created money, as occurs when the central bank implements a Quantitative Easing (QE) program? In this case there is no ‘crowding out’ of private sector investment.

According to MMT (Modern Monetary Theory) proponents as well as most Keynesians and Monetarists, the money supply increase that occurs when government debt is purchased using newly-created money is not a problem until/unless it leads to a large rise in the “general price level” as indicated by statistics such as the CPI. However, a rise in the general price level is not the only problem that can be caused by creating money out of nothing. It’s not even the main problem. The main problem is the distortions to interest rates and other price signals that the new money brings about. These distortions can lead to mal-investment on a grand scale.

In conclusion, sometimes a concept can be counterintuitive primarily because it is wrong. In accounting terms it can seem as if the government can ‘magically’ create wealth via deficit-spending, but only if you treat investment in government debt as equivalent to investment in productive endeavours and ignore the fact that creating money out of nothing tends to cause mal-investment.

Print This Post Print This Post

US monetary deflation intensifies

April 29, 2023

[This blog post is an excerpt from a recent commentary published at speculative-investor.com]

The US money-supply data for March-2023, which were published on Tuesday of this week, reveal that the monetary inflation rate has continued its ‘swan dive’. As illustrated below, the year-over-year growth rate of US True Money Supply (TMS) is now around negative 10%, that is, at the end of March-2023 the US money supply was about 10% smaller than it was a year earlier. The last time there was a double-digit annual percentage contraction in the US money supply was the early-1930s.

The Fed has signalled that it will maintain downward pressure on the money supply via its QT program, so a further decline in the monetary inflation rate is likely unless commercial banks lend enough new money into existence to counteract the Fed. So, what are the chances of the commercial banks generating enough new credit in the short-term to counteract the Fed?

Given the stresses that recently have emerged in the banking system combined with the trend towards tighter commercial bank lending standards that was well underway before last month’s banking panic and the plunge in the rate of bank credit growth illustrated by the following chart, the chances are slim to none. That is, a further monetary contraction appears to be in store.

Just to recap, in 2020 the Fed flooded the US economy and financial markets with dollars in an effort to make it seem as if the government could impose major restrictions on economic activity for several months without causing widespread hardship. Then, throughout 2021 the Fed acted as if the monetary deluge of 2020 would have only minor inflationary effects, mainly because major effects were yet to appear in backward-looking statistics such as the CPI. During the first half of 2022 the Fed finally realised that its prior actions had caused a major inflation problem, and in response it embarked on an aggressive monetary tightening program. However, by the time the Fed started tightening, the monetary inflation rate already had collapsed from a high of almost 40% to around 7% and the rate of CPI growth was within three months of its cycle peak.

Now we have the Fed still in tightening mode even though a) the US economy has just experienced the largest money-supply shrinkage since the Great Depression and b) the CPI growth rate is about 10 months into a cyclical decline. Why? Mainly because the backward-looking CPI hasn’t yet fallen far enough to reach the Fed’s arbitrary target.

At some point during the second half of this year the Fed will realise that its monetary tightening has gone too far, and at around the same time it will start coming under political pressure to create the illusion of prosperity in the lead-up to the November-2024 Presidential Election. It then undoubtedly will begin to lean in the opposite direction, again with its eyes firmly fixed on the rear-view mirror (backward-looking data). This will set the scene for the next great inflation wave.

The Federal Reserve is like a loose cannon on the deck of a ship in a storm. It is crashing into things and generally wreaking havoc, although unlike an actual loose cannon it pretends to be the opposite of what it is. It pretends to be a force for financial and economic stability.

The problem is the institution itself rather than the current leadership. The current leadership is inept and dangerous due a lack of understanding of what’s happening in the world, a lack of understanding of how its own actions affect long-term progress, and a strong belief that it knows what’s best. However, giving an individual or a committee the power to manipulate the money supply and interest rates would be problematic even if those doing the manipulating were competent.

Print This Post Print This Post

Gold and Real Interest Rates

April 17, 2023

[This blog post is an excerpt from a commentary published at TSI on 9th April]

The following chart shows that the yield on the 10-year Treasury Inflation-Protected Security (TIPS), a proxy for the real long-term US interest rate, has oscillated within a horizontal range over the past seven months. These interest rate swings may not appear to be significant, but they have had significant effects on the financial markets in general and the gold market in particular.

With regard to the effects on the gold market of the recent swings in the 10-year TIPS yield, we note that:

1. The multi-year high recorded by the 10-year TIPS yield on 3rd November of last year coincided with the end of a multi-year downward correction in the US$ gold price.

2. The short-term low in the 10-year TIPS yield on 1st February of this year coincided with a short-term peak in the US$ gold price.

3. The short-term high in the 10-year TIPS yield on 8th March coincided with the end of a short-term correction in the US$ gold price.

4. The US$ gold price rocketed upward from 8th March through to the end of last week as the 10-year TIPS yield moved back to the bottom of its range.

With the 10-year TIPS yield now at the bottom of its 7-month range, the most likely direction of the next multi-week move is upward. However, at some point there will be a sustained breakout from this range, with major consequences for the financial markets.

If the eventual breakout in the 10-year TIPS yield is to the upside, it will be bearish for everything except the US dollar. This is a low-probability scenario because it would require the Fed to either continue its monetary tightening in the face of severe economic weakness or take no action when presented with obvious evidence of deflation.

If the eventual breakout in the 10-year TIPS yield is to the downside, the consequences for asset and commodity prices will depend on whether the primary driver of the breakout is a falling nominal yield or rising inflation expectations (the real interest rate is the nominal interest rate minus the EXPECTED inflation rate). A downside breakout in the real interest rate that was driven by a falling nominal yield would be bullish for gold and probably also would be bullish for the US$ relative to other major currencies, while being bearish for most commodities and equities. This is because it likely would result from severe economic weakness. A downside breakout in the real interest rate that was driven by rising inflation expectations would be bullish for gold, but more bullish for cyclical commodities (e.g. the industrial metals) and equities. It would be bearish for the US$.

We expect that at some point within the next four months the 10-year TIPS yield will make a sustained break below the bottom of its range, primarily due to falling nominal interest rates. It could happen as soon as this month, but July-August is a more likely timeframe. It mainly depends on how quickly the economy deteriorates.

Print This Post Print This Post

Is a yield curve reversal in progress?

April 4, 2023

[This blog post is an excerpt from a TSI commentary published last week]

The US 10yr-2yr yield spread, a proxy for the US yield curve, has rebounded sharply over the past couple of weeks (refer to the following daily chart), from more than 100 basis points below zero to ‘only’ about 50 basis points below zero. Is this the start of a steepening trend for the US yield curve?

There is one good reason to believe that the recent upturn shown on the above chart did NOT mark the start of a new trend. The reason is the relationship between the monetary inflation rate (the blue line) and the 10yr-2yr yield spread (the red line) illustrated on the chart displayed below. This chart shows that the yield spread tends to follow the monetary inflation rate and that the monetary inflation rate was still in a downward trend at the end of February-2023.

Further to the above chart, a yield curve inversion is caused by a large decline in the monetary inflation rate and a major shift in the yield curve to a new steepening trend is caused by a major upward reversal in the monetary inflation rate. Currently there is no sign of an upward reversal in the monetary inflation rate.

As an aside, the 10yr-2yr spread is just one indicator of the yield curve. The 10yr-3mth spread (see chart below) is equally important and made a new inversion extreme on Monday of this week. In other words, there is no evidence of a shift towards steepening in the 10yr-3mth spread.

Perhaps it will be different this time and a yield curve shift to a steepening trend will precede a money-supply growth rate reversal, but we wouldn’t bet on it. As long as monetary conditions as indicated by the monetary inflation rate are still tightening, there will be upward pressure on short-term interest rates relative to long-term interest rates. This is because short-term interest rates will be kept relatively high by the increasingly urgent desire for short-term financing, while long-term zero-risk interest rates will reflect the expected eventual effects on prices and economic activity of today’s tight monetary conditions.

Print This Post Print This Post

The Anti-Bank

March 28, 2023

[This blog post is an excerpt from a commentary published at TSI last week]

The senior central banks (the Fed and the ECB) hiked their interest rate targets over the past several days and have stated that more rate hikes will be needed to quell the inflation that they, themselves, created*. However, the pressure to stop hiking and to start cutting is building and probably will continue to do so over the next few months. This is important for most financial markets and is especially important for the gold market.

A problem facing the central banks is that they can ‘ring fence’ the banking industry, especially in the US where the major banks are in good financial shape, but they cannot protect the entire financial system without turning from monetary tightening to monetary loosening. Of particular relevance, whereas the banking system is mostly transparent (from the perspective of central banks) and can be supported by targeted measures such as the new Bank Term Funding Program (BTFP), many transactions in the so-called “Shadow Banking System” involve counterparties that are not subject to bank regulations and occur outside the central banks’ field of view. The best example is the Repo (Repurchase Agreement) market, which should not be confused with the Fed’s Reverse Repo facility.

Whereas the Fed’s Reverse Repo facility is well defined in terms of size (currently about US$2.3 trillion) and participants, and is of course within the Fed’s control, the Repo market is even bigger (we are talking multi-trillions of dollars of transactions per day) and involves hedge funds and corporations as well as various financial institutions (banks, MMFs, primary dealers, brokers, pension funds, etc.). A Repo is simply a transaction in which one firm sells securities (typically Treasuries) to another firm and agrees to buy the securities back at a slightly higher price in the future (typically the next day). The difference between the sell price and the buy price is known as the “repo rate”, which effectively is an interest rate. Normally the repo rate is very close to the Fed Funds Rate.

The Fed was forced to intervene in the Repo market in September-2019 to address a liquidity crunch that caused short-term interest rates to spike well above the Fed’s target, and again in 2020 in reaction to a sudden cash shortage caused by the COVID lockdowns. It did this by expanding its balance sheet and creating money out of nothing — a moderate amount of money in reaction to the September-2019 cash crunch and a massive amount of money in reaction to the lockdowns. Most of the time, however, the Repo market just chugs along in the background like the plumbing system that distributes water around a large commercial building.

In a nutshell, the problem for the senior central banks is that while the commercial banking system can be prevented from blowing up while monetary tightening continues, the monetary tightening eventually will lead to blow-ups among other financial operators that are big enough to disrupt the workings of the financial system. The specific major blow-ups usually can’t be identified ahead of time, but if the tightening continues they will happen (actually, there already has been more than enough tightening to set the scene for such events). And when they happen they will not only stop the central banks from doing additional rate hikes, they probably will result in emergency rate cuts and balance-sheet expansions.

The above comments are in the gold section because this is the stuff that really matters for gold. Gold is not the anti-dollar, as it is sometimes labelled. It is also not a hedge against inflation, although like many other ‘hard’ assets it has retained its value over the very long-term. Instead, it is reasonable to think of gold as the anti-bank or the anti-financial-system. As a result, gold’s price is driven by confidence in the financial system and the main official supporters of the financial system (the government and the central bank), which can be quantified to a meaningful extent using certain ratios and interest-rate spreads. Falling confidence leads to a higher valuation for gold, rising confidence leads to a lower valuation for gold.

*That’s not exactly what they are saying, in that they are not accepting blame for the inflation problem. They are saying that more rate hikes are needed to quell the inflation that has arisen due to exogenous and unforeseeable forces.

Print This Post Print This Post

Fed Fighting

March 15, 2023

[This blog post is an excerpt from a TSI commentary published on 12th March 2023]

The financial markets have been fighting the Fed since October of last year and especially since the start of this year, in two ways. The first involves bidding-up stock prices in anticipation of a ‘Fed pivot’, which we have described as a self-defeating strategy. The second involves factoring lower interest rates into bond prices, which we thought made sense. What is the current state of play in the battle between the markets and the Fed?

Just to recap, we wrote in many previous commentaries that stock market bulls would get the monetary policy reversal on which they were betting only AFTER the SPX plunged to new bear-market lows and the economic data had become weak enough to remove all doubt that a recession was underway. In other words, a very weak stock market was one of the prerequisites for the policy reversal. That, in essence, is why bidding-up prices in anticipation of a policy reversal was/is viewed as a self-defeating strategy. Also worth reiterating is that previous equity bear markets were not close to complete when the Fed made its first rate cut. This implies that if we are still months away from the Fed’s first rate cut then we could be a year away from the final bear market low.

Regarding the other aspect of the Fed fighting, we have written that interest rates probably would move much lower over the course of 2023 due to an economic recession, an extension of the downward trend in inflation expectations and a collapse in the year-over-year CPI growth rate. This meant that from our perspective the financial markets were right to be factoring lower interest rates into Treasury securities with durations of two years or more. However, in the 16th January 2023 Weekly Update we cautioned: “…the recent eagerness of traders to push-up asset prices in anticipation of easier monetary policy has, ironically, extended the likely duration of the Fed’s monetary tightening. Therefore, while the markets probably are right to discount lower interest rates over the coming year, ‘fighting the Fed’ has created a high risk of interest rates rising over the next 1-3 months.

Partly due to equity traders attempting to ‘front run’ the Fed, the monetary tightening has been extended and interest rates rose markedly from mid-January through to the first half of last week. The 10-year and 30-year Treasury yields have remained below their October-2022 cycle highs, but the 2-year Treasury yield, which had signalled a downward reversal late last year, made new highs over the past fortnight.

The following chart shows the surge in the 2-year Treasury yield from a multi-month low in mid-January to a new cycle high during the first half of last week. It also shows that there was a sharp decline during the second half of last week. Will the latest downward reversal stick?

We suspect that it will. It’s likely that 10-year and 30-year Treasury yields have reversed downward after making lower highs, and that the 2-year Treasury yield has made a sustainable downward reversal from a slightly higher high for the cycle. This is the case because other markets are signalling the start of a shift away from risk.

There’s a good chance that within the next few months stock market bulls will get the Fed pivot they have been betting on. However, they probably will get it with the SPX at 3000 or lower.

Print This Post Print This Post