US Recession Watch
Posted By Jacqui On June 5, 2023 @ 11:08 pm In Uncategorized | Comments Disabled
[This blog post is an excerpt from a recent commentary published at speculative-investor.com [1]]
Leading indicators of the US economy continue to signal imminent recession, but coincident indicators are mixed and some lagging indicators, most notably employment, are still showing strength. Therefore, it isn’t clear whether or not a recession has commenced. Also, high-profile parts of the stock market are muddying the water by trading as if a “soft landing” (no recession, but a large-enough inflation decline to cause the Fed to reverse course) were the most likely economic outcome over the next several months.
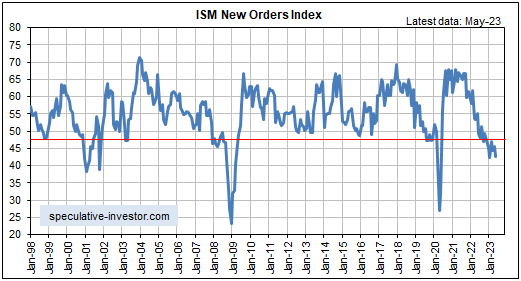
Turning to our favourite two leading indicators, first up we have a chart showing that the ISM Manufacturing New Orders Index (NOI) made its cycle low to date in January-2023 and returned to its cycle low in May-2023. As noted in previous TSI commentaries, at no time since 1970 has the ISM Manufacturing NOI been as low as it is today without the US economy being either in recession or about to enter recession.

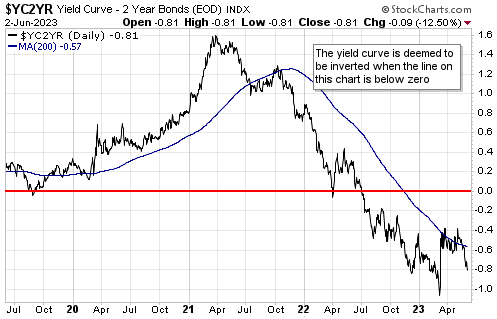
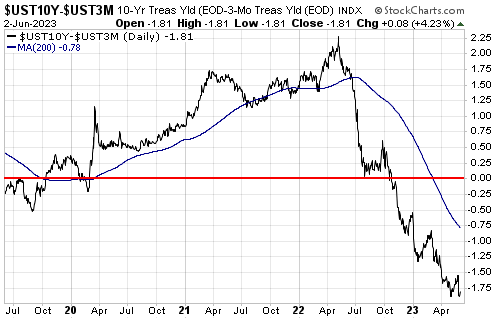
Next up is the yield curve, which remains inverted to an extreme. The extreme inversion tells us that monetary conditions have become tight enough to virtually guarantee an official recession, but the signal that a recession is imminent is a reversal of the yield curve from flattening/inverting to steepening.
A yield curve reversal from flattening/inverting to steepening has not happened, yet. It’s possible that the rebound in the 10-year T-Note yield minus the 2-year T-Note yield (the 10y-2y spread) from its March-2023 low is the start of a reversal, but the 10-year T-Note yield minus the 3-month T-Note yield (the 10y-3m spread), an equally important measure of the yield curve, just hit a new inversion extreme for the cycle. Daily charts of these interest rate spreads are displayed below.


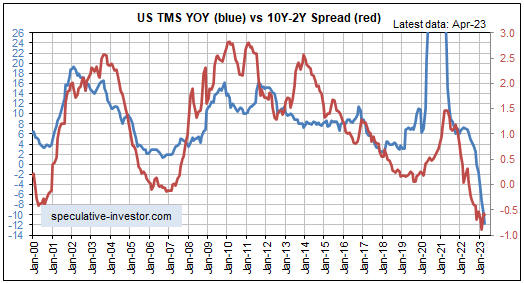
As explained in the past, the yield curve is driven by the monetary inflation rate and tends to lag the monetary inflation rate at major turning points. Of particular relevance at this time, a reversal in the yield curve from flattening/inverting to steepening usually follows a major upward reversal in the monetary inflation rate. This relationship is illustrated by the monthly chart displayed below. The red line on this chart is the 10y-2y spread and the blue line is the growth rate of US True Money Supply (TMS).
Clearly, the monetary inflation rate has not yet reversed upward. This indicates that the monetary conditions for a yield curve reversal are not yet in place.
Note that for the monetary inflation rate to begin trending upward in the near future, a large amount of money probably will have to exit the Fed’s Reverse Repo facility. This could happen in response to the flood of new debt that will be issued by the Treasury within the next couple of months.

In conclusion, it’s possible that a US economic recession has begun, but it’s now more likely that a recession won’t begin until the third quarter of this year.
Article printed from TSI Blog: https://tsi-blog.com
Click here to print.