[This blog post is an excerpt from a TSI commentary published on 24th February]
Based on the par value of maturing securities on its balance sheet there was scope for the Fed to withdraw as much as $43B from the financial markets on 15th February. A week ago we noted that this ‘liquidity drain’ had no effect on the stock market, possibly because the effect would occur on the next trading day (Tuesday 19th February) or because the Fed chose to withdraw a lot less money than it could have. Now that the Fed has issued its latest weekly balance sheet update we can see why there was no effect from this potential bout of “quantitative tightening” (QT). We can also see that the general perception of what the Fed is doing has deviated in a big way from what the Fed actually is doing.
During the 7-day period from 13th to 20th February the Fed’s securities portfolio fell by $31B. In other words, the Fed implemented $31B of a potential maximum $43B of QT. Over the same period, however, the amount of money in the US federal government’s account at the Fed fell by $44B. This means that there was a $31B withdrawal of liquidity by the Fed in parallel with a $44B injection of liquidity by the government, resulting in a net liquidity ADDITION of $13B. No wonder there wasn’t a noticeable negative effect on the stock market from the Fed’s actions.
The difference between a Fed liquidity injection and a government liquidity injection is that whereas the Fed can inject new money, the government can only recycle existing money (the government returns to the economy the money it previously removed via borrowing or taxation). Government liquidity injections therefore are not inflationary, but their short-term effects can be similar to Fed liquidity injections.
Note that at 20th February the government had about $330B in its account at the Fed. This means that the government currently has the ability to inject up to $330B into the economy, but depending on the size of its desired cash float it may or may not make additional injections in the short-term.
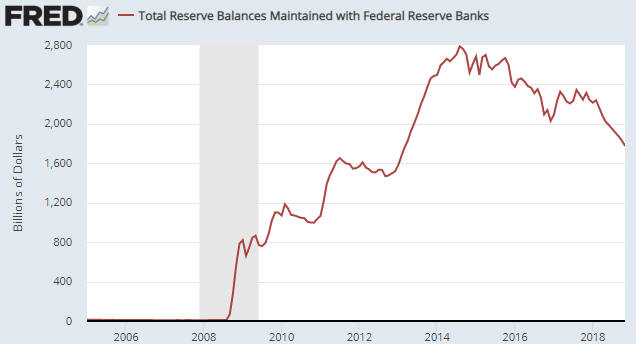
Also note that notwithstanding all of the ‘dovish’ talk that has emanated from the Fed over the past two months, the QT program has continued. From 2nd January to 20th February the Fed removed $63B from the economy as part of its “balance sheet normalisation”. The pace of the liquidity removal is slower than the Fed’s self-imposed $50B/month limit, but it is not correct to say — as some pundits have said — that the Fed has stopped tightening. The Fed is still pulling on the monetary reins.
That the Fed is still tightening means that there is a substantial mismatch at the moment between perception and reality. The general perception is that the Fed is now either on hold or preparing to loosen, but, as mentioned above, this most definitely is not the case. Consequently, bullish speculators in the stock, commodity and gold markets are getting ahead of themselves.
It’s possible that the Fed will end its monetary tightening within the next few months, but that’s only going to happen if there’s another pronounced shift away from risk. To put it another way, the more the markets discount an easing of monetary policy the less chance the easing will occur. In fact, if the stock market extends its upward trend into May-June then the Fed probably will resume its rate-hiking in June.
 Print This Post

