Gold’s true fundamentals are mixed, at best

September 11, 2015

To paraphrase Jim Grant, gold’s perceived value in US$ terms is the reciprocal of confidence in the Fed and/or the US economy. That’s why the things I refer to as gold’s true fundamentals are measures of confidence in the Fed and/or the US economy. I’ve been covering these fundamental drivers of the gold price in TSI commentaries for about 15 years.

Note that I use the word “true” to distinguish the actual fundamental drivers of the gold price from the drivers that are regularly cited by the majority of gold-market analysts and commentators. According to many pontificators, gold’s fundamentals include the volume of gold being imported by China, the volume of gold being transferred out of the Shanghai Futures Exchange inventory, the amount of “registered” gold at the COMEX, India’s monsoon and wedding seasons, the amount of gold being bought/sold by various central banks, changes in mine production and scrap supply, and wild guesses regarding JP Morgan’s exposure to gold. These aren’t true fundamental price drivers. At best, they are distractions.

In no particular order, the gold market’s five most important fundamental drivers are the real interest rate, the yield curve, credit spreads, the relative strength of the banking sector, and the US dollar’s exchange rate.

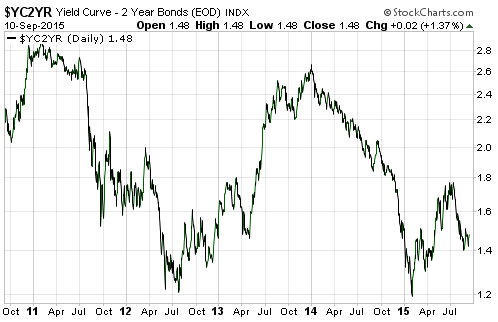
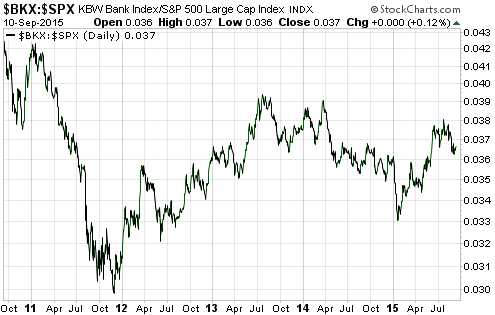
Over the past 2 years gold’s true fundamentals have usually been mixed, meaning neither clearly bullish nor clearly bearish. What has tended to happen during this period is that when one of the fundamentals has moved decisively in one direction it has been counteracted by a move in the opposite direction by one of the others. For example, when credit spreads began to widen (gold-bullish) in mid-2014, the flattening of the yield curve (gold-bearish) accelerated. For another example, when the yield curve reversed direction and began to steepen (gold-bullish) in January of this year, the real interest rate turned upward (gold-bearish) and the banking sector began to strengthen relative to the broad stock market (gold-bearish).

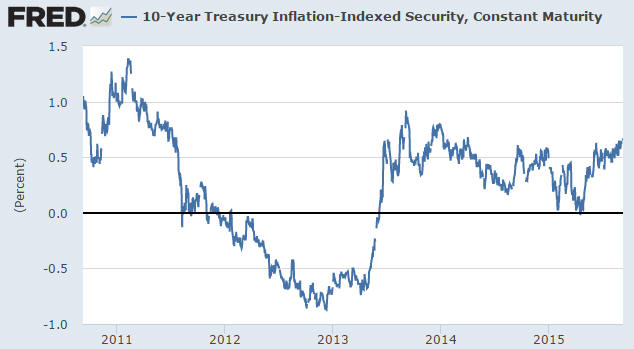
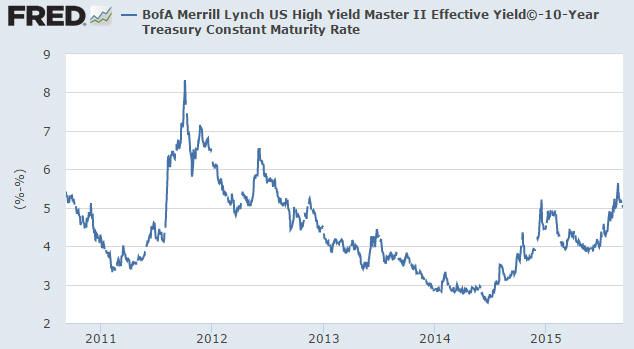
Charts illustrating the performances over the past 5 years of the first four of the above-mentioned fundamental drivers of the gold market are displayed below. The first chart shows that the 10-year TIPS yield, a proxy for the real US interest rate, made a 2-year low in April of this year but has since moved to a 1-year high and into the top third of its 2-year range. This is bearish for gold. The second chart shows that a proxy for US credit spreads has been working its way upward since mid-2014 and recently broke to a new 2-year high. This is bullish for gold. The third chart shows that the US yield curve began to steepen in January, which is bullish for gold, but its performance over the past two months casts doubt as to this driver’s current message. And the fourth chart shows that after being relatively weak from July-2013 through to January-2015, the bank sector suddenly became relatively strong early this year. This driver has therefore shifted from gold-bullish to gold-bearish.

The overall picture painted by these charts is that gold’s fundamentals are still mixed, although there is perhaps a slight bearish skew due to the new 12-month high in the real interest rate. I’m anticipating a shift towards a more gold-bullish fundamental backdrop, but it hasn’t happened yet.

TIPS_100915

creditspread_100915

yieldcurve_100915

BKX_SPX_100915

Print This Post Print This Post

Money need not be anything in particular

September 9, 2015

This post was inspired by an exchange between Martin Armstrong of Armstrong Economics and one of his readers. In an earlier blog entry Mr. Armstrong wrote: “The wealth of a nation is the total productivity of its people. If I have gold and want you to fix my house, I give you the gold for your labor. Thus, your wealth is your labor, and the gold is merely a medium of exchange. So it does not matter whatever the medium of exchange might be.” One of his readers took exception to this comment and argued that money should be tangible and ideally should be gold or silver.

Mr. Armstrong’s reply is worth reading in full. After giving us an abbreviated history of money through the ages, he sums up as follows:

Paper money is the medium of exchange between two people where one offers a service or something they manufactured, which is no different than a gold or silver coin requiring CONFIDENCE and an agreed value at that moment of exchange. You can no more eat paper money to survive than you can gold or silver. All require CONFIDENCE of a third party accepting it in exchange. For the medium of exchange to be truly TANGIBLE it must have a practical utilitarian value and that historically is the distinction of a barter system vs. post-Bronze Age REPRESENTATIVE/INTANGIBLE based monetary systems predicated upon CONFIDENCE.

I agree with Mr. Armstrong’s central point. Many gold advocates assert that gold is “real wealth” and has intrinsic value, which is patently wrong. Value is subjective and will change based on circumstances. For example, you might place a high value on gold in your current circumstances, but if you were stranded alone on an island with no hope of rescue then gold would probably have no value to you. Gold has exactly the same intrinsic value as a Federal Reserve note: zero.

However, he is very wrong when he states: “…it does not matter whatever the medium of exchange might be.” On the contrary, it matters more than almost anything in economics!

The problem with today’s monetary system isn’t that the general medium of exchange (money) has no intrinsic value. As noted above, money also had no intrinsic value when it was gold. The problem with today’s monetary system is that an unholy alliance of banks and government has near-total control of money. Banks have the power to create new money at whim, as does the government via the central bank.

Aside from the comparatively minor problem of causing the purchasing power of money to erode over time, the creation of money out of nothing by commercial banks and central banks distorts the relative-price signals that guide investment. This happens because the money enters the economy in a non-uniform way. In the US over the past several years, for example, most new money entered the economy via Primary Dealers who used it to purchase financial assets from other large speculators. The stock and bond markets were therefore the first and biggest beneficiaries of the new money, which led to an abnormally-large proportion of investment being directed towards strategies designed to profit from rising equity prices and low/falling interest rates. Such investment generally doesn’t add anything to the productive capacity of the economy. In fact, it often results in capital consumption.

Instead of saying “it does not matter whatever the medium of exchange might be”, what Mr. Armstrong should have said was: it does not matter whatever the medium of exchange might be, as long as it is chosen by the free market. Putting it another way, the government should stay out of the money business.

Print This Post Print This Post

The right way to think about gold supply

September 4, 2015

Here’s the wrong way to think about gold supply: “Although gold’s aboveground inventory is huge compared to current production, only a tiny fraction of this gold will usually be available for sale near the current price. Therefore, changes in mine supply can be important influences on the gold price.” I’ll now explain the right way to think about gold supply.

Whenever I point out that the supply side of the gold market consists of the entire aboveground gold inventory, which is probably somewhere between 150K tonnes and 200K tonnes, and that the gold-mining industry does no more than add about 1.5%/year to this inventory, an objection I often get is that only a tiny fraction of the aboveground inventory is available for sale at any time. This is of course true, and nobody who has a correct understanding of gold supply has ever claimed otherwise.

If all, or even most, of the aboveground supply were for sale at the current price then the price would not be able to rise. The price can rise and fall by substantial amounts, however, because there is always a huge range of prices at which the owners of the aboveground supply are prepared to sell. Moreover, this range is constantly changing based on changing personal circumstances and assessments of the market. In addition, some holders of existing aboveground gold will be planning to hold forever. These plans, which are themselves subject to change in response to changing circumstances, also factor into the formation of the gold price, in that a decision to withhold X ounces of supply can have a similar effect to a decision to buy X ounces.

As I write, gold is trading in the $1120s. It is therefore certain that a tiny fraction of the aboveground supply is currently changing hands in the $1120s and that there are plans in place to sell other tiny fractions in the $1130s, the $1140s, the $1150s, and all the way up to some extremely high number. Some people will also have plans to sell gold if the gold price falls below a particular level and there will be millions of people who have no specific selling intentions who will decide to sell in the future for some currently unforeseeable reason. At the same time there will be countless plans in place to buy at certain levels and millions of people with no present intention to buy who will, for reasons that aren’t currently foreseeable, decide to buy in the future.

It is the combination of these myriad plans that determines the price. Furthermore and as mentioned above, over the days ahead many of these plans will change. For example, some gold-buying/selling intentions will change based on what happens to the stock market or the bond market.

How does the gold-mining industry fit into the situation?

The gold-mining industry is not materially different from any other seller except that its plans are not price sensitive. Specifically, every year it will sell an amount that’s equivalent to about 1.5% of the total aboveground supply regardless of price. At this time four years ago it was selling gold in the $1800s and it is now selling roughly the same amount of gold in the $1100s. It is the ultimate price-taker. To put it another way: whatever price arises from the changing plans of gold owners and potential owners, that’s the price at which gold producers will sell.

On a related matter, due to the huge existing aboveground supply of gold there should never be a genuine shortage of physical gold. Obtaining more gold should always be solely a question price. A consequence is that the gold market should never go into “backwardation”, that is, the spot gold price should always be lower than the price for future delivery. Just to be clear: in an abundantly-supplied commodity market the futures price should be higher than the spot price by enough to eliminate the risk-free profit that could otherwise be had by selling the physical and buying the futures. That’s why it would be very significant if the gold market were to make a sustained and sizeable move into backwardation. Such a development would indicate that holders of the aboveground supply were withdrawing their gold from the market en masse and/or that the gold futures market was breaking down due a collapse in trust. Even the small and brief backwardations of the past two years have some significance*, although recent gold backwardation episodes have more to do with near-zero short-term US$ interest rates than gold supply/demand. The point is that gold backwardation is only important because the existing aboveground supply in saleable form dwarfs the rate of annual production.

In summary, the price of gold is where it is because of the range of prices at which existing holders intend to become sellers and the concurrent range of prices at which potential future holders intend to become buyers. These ranges are constantly in flux due to changing perceptions and circumstances.

*Keith Weiner has written extensively about the significance of gold backwardation at https://monetary-metals.com/.

Print This Post Print This Post

Quick 10% declines aren’t extraordinary

September 1, 2015

Here is an excerpt from a commentary posted at TSI on 30th August:

During bull-market years and bear-market years, it is not uncommon for the US stock market to experience a quick decline of 10% or more at some point. For example, there was at least one quick decline of 10% or more in 1994, 1996, 1997, 1998, 1999, 2000, 2001, 2002, 2003, 2007, 2008, 2009, 2010, 2011 and 2012. In other words, 15 out of the 19 years from 1994 to 2012, inclusive, had quick declines of 10% or more. Only two of these years (2001 and 2008) had declines that could reasonably be called crashes.

The periods from mid-2003 through to early-2007 and late-2012 through to mid-2015 were unusual because they did NOT contain any quick 10%+ declines. In other words, the 12.5% decline in the S&P500 Index (SPX) from its July peak to last Monday’s low was not extraordinary in an historical context, it only seemed extraordinary because the market had gone an unusually long time without experiencing such a decline. That is, it only seemed extraordinary due to “recency bias” (the tendency to think that trends and patterns we observe in the recent past will continue in the future). Furthermore and as noted in the email sent to subscribers late last week, this year’s July-August decline was significantly smaller than the July-August decline that formed part of a bull-market correction in 2011.

In summary, what happened over the past few weeks was not a crash by any reasonable definition of the word and was only extraordinary in the context of the unusually long period of low volatility that preceded it.

That being said, the recent market action could well have longer-term significance. Just as the sudden increase in volatility in 2007 following a multi-year period of exceptionally-low volatility marked the end of a cyclical bull market, the sudden increase in volatility over the past few weeks could be marking the end of a cyclical bull market. In fact, there is a better-than-even-money chance that this is the case.

Also, while the recent quick decline doesn’t meet a reasonable definition of a stock-market crash, it could be part of a developing crash pattern. Recall from previous TSI commentaries that a US stock-market crash pattern involves an initial sharp decline in the 7%-15% range (step 1) followed by a rebound that retraces at least 50% of the initial decline (step 2) and then a drop back to support defined by the low of the initial decline (step 3). A breach of support can then result in a crash. Step 1 of a potential crash pattern is complete and step 2 is now very close to being complete. Note, however, that even if steps 2 and 3 are completed over the next couple of weeks the probability of a crash will still be low, albeit much higher than it was a few weeks ago.

Print This Post Print This Post