[This blog post is an excerpt from a recent commentary posted at www.speculative-investor.com]
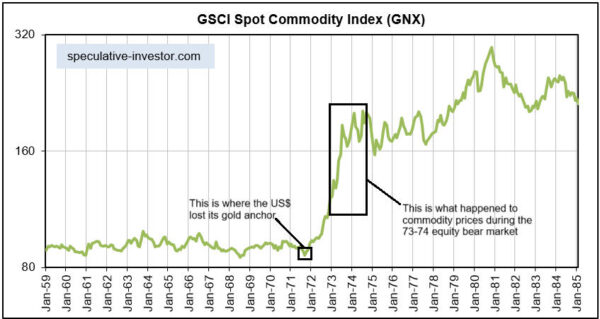
Due to everything we are seeing and expecting, including the performance of the gold price and shortages that potentially will stem from Trump’s trade war, we think there’s a very real possibility that an equity bear market could unfold in parallel with a commodity bull market. If so, it would be very different from anything that happened over the past three decades, a period during which the commodity markets generally weakened when the stock market was very weak, but very similar to what happened during the 1970s. As illustrated by the following monthly chart, a broad basket of commodity prices rose substantially during the equity bear market of 1973-1974.
By the way, the chart also shows the remarkable stability of commodity prices when the US$ was linked officially to gold.
We hasten to point out that right now there is only tentative evidence in the price action to support the above-mentioned scenario. In particular, the first of the following charts shows that equity prices (represented by the SPX and shown in green) and commodity prices (represented by the GNX and shown in black) plunged together in early April and have since rebounded together — price action that does NOT support the idea that commodity prices will be able to trend upward while equity prices trend downward. However, the second chart shows that commodity prices have been strengthening relative to equity prices since early-December of last year.
What we could see over the coming quarters is more of what happened since early-December of last year, with commodity prices generally strengthening relative to equity prices but getting hit during the brief periods when equity prices fall rapidly and there is a rush for liquidity.
 Print This Post