
In a blog post in February of last year I explained that an inversion of the US yield curve has never been a recession signal. Instead, the genuine recession signal has always been the reversal in the curve from ‘flattening’ (short-term interest rates rising relative to long-term interest rates) to ‘steepening’ (short-term interest rates falling relative to long-term interest rates) after an extreme is reached. It just so happens that under normal monetary conditions an extreme usually isn’t reached and the reversal therefore doesn’t occur until after the yield curve becomes inverted.
The fact is that it doesn’t matter how ‘flat’ or inverted the yield curve becomes, there’s a good chance that the monetary-inflation-fueled economic boom will be intact as long as short-term interest rates are rising relative to long-term interest rates. The reason, in a nutshell, is that the boom periods are dominated by borrowing short to lend or invest long, a process that puts upward pressure on short-term interest rates relative to long-term interest rates. It’s when short-term interest rates begin trending downward relative to long-term interest rates that we know the boom is in trouble.
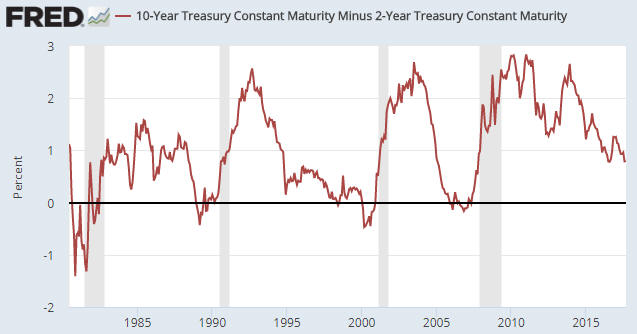
The following chart shows that the spread between the 10-year T-Note yield and the 2-year T-Note yield is much narrower now than it was a few years ago. This means that there has been a substantial flattening of the US yield curve. Also, the chart shows no evidence of a trend reversal. This implies that the inflation-fueled boom is still intact.
About Steven Saville
 Print This Post