Print This Post Print This Post

Chanting “it’s a bull market” won’t make it so

October 28, 2016

I’ve seen a lot of commentary in which the author assumes that this year’s rally in the gold price is the first rally in a new cyclical bull market. It probably is, but at this stage — as the saying goes — the jury is still out. At this stage it’s best to reserve judgment, because blindly assuming something that might not be true can lead to large losses.

There are two main reasons that ‘the jury is still out’. First and foremost, at no time over the past 12 months have gold’s true fundamentals* been definitively bullish. Instead, they have oscillated around neutral. There have been periods, such as February-April of this year, during which the fundamentals had a bullish skew, but after tipping in the bullish direction for at most 3 months they have always tipped in the other direction for a while.

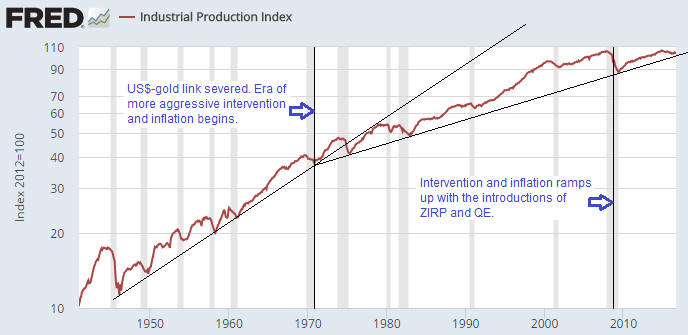
Considering what central banks have been doing to the official forms of money my statement that the fundamental backdrop is not definitively gold-bullish could seem strange. After all, the ECB is firmly committed to asset monetisation and negative interest rates based on the belief that these counter-productive policies are working, and the Federal Reserve is seemingly afraid to take even a small step towards “policy normalisation” despite its targets for employment and “inflation” having been reached more than three years ago. However, gold’s fundamentals are determined by confidence, not by sound principles of economics. To put it another way, whether the fundamental backdrop is bullish or bearish for gold is determined by the general perception of what’s happening on the economic and monetary fronts rather than what’s actually happening. Perception will eventually move into line with reality, but in the meantime years can go by.

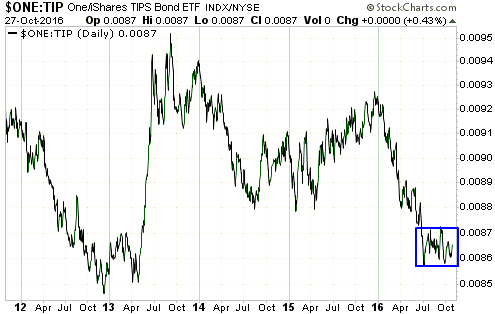
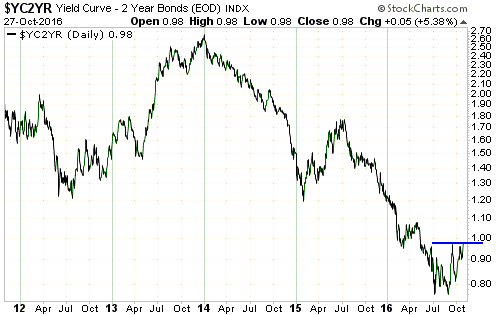
Since early-July the true fundamentals have been neutral at best and over the past month they have, on balance, been slightly bearish. However, they are constantly in flux and it currently wouldn’t take much to shift them to bullish or make them definitively bearish. In particular, two of the most important fundamental drivers of the gold price are neutral and positioned in a way that they could soon shift decisively in one direction or the other. I’m referring to the real interest rate, as indicated on the first of the following charts by the reciprocal of the TIPS bond ETF (1/TIP), and the US yield curve, as indicated on the second of the following charts by the 10yr-2yr yield spread.

The real interest rate would turn decisively gold-bullish if 1/TIP were to break downward from its recent 4-month range and decisively gold-bearish if 1/TIP were to break upward from its recent 4-month range. The yield curve, which has been gold-bearish for the bulk of the past three years, would turn decisively gold-bullish if the 10yr-2yr yield spread were to break solidly above its September high. Note that it is very close to doing exactly that. As an aside, a break by the 10yr-2yr yield spread above its September high would also be a recession warning and a bearish omen for the stock market.

Realint_271016

yieldcurve_271016

The price action is the other reason for the uncertainty as to whether this year’s rally marked the start of a cyclical bull market. I’m referring to the fact that of all the rallies in gold and the gold-mining indices from multi-year lows, this year’s rally is most similar to the bear-market rebound of 1982-1983.

The gold rally that began in December of 2015 will differentiate itself from the 1982-1983 bear-market rebound if the gold price closes above its July-2016 peak AND the HUI closes above its August-2016 peak.

Fortunately, you don’t need to be a fervent believer in the ‘new gold bull market’ story to make money from the rallies in gold and gold stocks. You will just tend to be more cautious than the bulls with blind faith.

*Five of the six “true fundamentals” were mentioned in the September-2015 TSI blog post linked HERE. The sixth is the general trend in commodity prices as indicated by a broad-based commodity index such as GNX.

Print This Post Print This Post

“Price inflation” is not the biggest problem

October 18, 2016

All else remaining equal, an increase in the supply of money will lead to a decrease in the purchasing-power (price) of money. Furthermore, this is the only effect of monetary inflation that the average economist or central banker cares about. Increases in the money supply are therefore generally considered to be harmless or even beneficial as long as the purchasing-power of money is perceived to be fairly stable*. However, reduced purchasing-power for money is not the most important adverse effect of monetary inflation.

If an increase in the supply of money led to a proportional shift in prices throughout the economy then its consequences would be both easy to see and not particularly troublesome. Unfortunately, that’s not the way it happens. What actually happens is that monetary inflation causes changes in relative prices, with the spending of the first recipients of the newly-created money determining the prices that rise the first and the most.

Changes in relative prices generate signals that direct investment. The further these signals are from reality, that is, the more these signals are distorted by the creation of new money, the more investing errors there will be and the less productive the economy will become.

Also, although adding to the money supply cannot possibly increase the economy-wide level of savings, monetary inflation temporarily creates the impression that there are more savings than is actually the case. This reduces interest rates, which prompts investments in ventures that are predicated on unrealistic forecasts of future consumer spending. Again, the eventual result will be a less productive economy.

During any given year it usually won’t be possible to separate-out the pernicious effects of monetary inflation and the distortion of interest rates that goes hand-in-hand with it from all the other forces affecting the economy. There will simply be too many things going on in the world that could be influencing the data. However, by taking a wide-angle (that is, long term) view it will often be possible to see the effects on the economy of shifts in monetary inflation.

As an example of how long-term shifts in monetary inflation/intervention can be linked to long-term shifts in economic progress I present the following chart of the US Industrial Production Index. The chart shows that the industrial-production growth trend flattened at around the time that the ‘golden shackles’ were removed, that is, at around the time that the Fed was essentially empowered to do a lot more. This is not a fluke. The chart also shows that the ramping-up of the Fed’s monetary interventions in 2008-2009 has been followed by the weakest post-recession recovery in at least 70 years. Again, this is not a fluke.

IndustProd_181016

In economics, to have a chance of correctly interpreting cause and effect in the data you first have to know the right theory. That’s why Keynesian economists will not link the US industrial production slowdown with the Fed’s increasingly aggressive monetary interventions. From their perspective, the only negative effect that monetary inflation can possibly have is to make the cost of living rise at a faster pace than they believe it should be rising.

*Stable, here, means rising at around 2% per year. Note that it is not possible to come up with a single number that represents the economy-wide purchasing power of money, but this doesn’t stop the government (and some private organisations and individuals) from doing exactly that.

Print This Post Print This Post

The gold manipulation silliness continues

October 14, 2016

Not surprisingly, one of the silliest explanations for last week’s sharp decline in the gold price appeared in an article posted at the Zero Hedge web site. According to this article, the only plausible explanation for the decline is rampant manipulation while China’s markets were closed for the “Golden Week” public holidays*.

In an effort to prove that manipulators in the West routinely take advantage of China’s markets being closed to suppress the gold price, the article includes charts covering the 2015 and 2014 “Golden Week” holiday periods. These charts suggest that, as was the case this year, the gold price tanked during each of the preceding two years when China was closed for business. However, the charts are very misleading. Deliberately so, in my opinion.

For example, the following chart from the article suggests that the gold price plunged from the $1140s to around $1105 during the 2015 “Golden Week” holidays and then quickly recouped its losses after China’s markets re-opened, but that’s not the case. The “Golden Week” is from 1st to 7th October every year, so what actually happened was that the gold price fell from the $1140′s down to around $1115 during the days leading up to the 2015 “Golden Week” (while China was open for business) and then rebounded to the $1140s while China was on holiday.

gold_2015_141016

During the 2014 “Golden Week” holiday period there was no net change in the gold price.

The belief that manipulation is the be-all-and-end-all of the gold market is based on two false premises. The first is that the fundamentals are always gold-bullish. The second is that when financial markets are free from manipulation they always move in concert with the fundamentals. If you hold these two totally-wrong beliefs then every time there is a significant decline in the gold price you will naturally conclude that manipulation was the cause.

The reality is that gold’s true fundamentals have been deteriorating since July and that the pace of deterioration picked up over the past three weeks. At the same time, speculators in gold futures were adding to the risk of a steep downward price adjustment by stubbornly maintaining an extremely high net-long position.

The following chart compares the gold price with the bond/dollar ratio. The fundamental deterioration and the delayed response of the gold market can clearly be seen on this chart.

Gold market participants and observers who were looking at the right indicators will not have been surprised by last week’s price decline.

*China is apparently the bastion of honest price discovery in the gold market and corrupt Western bankers apparently wait for the Chinese to go on vacation before launching their bear raids.

Print This Post Print This Post

Most people want price controls

October 11, 2016

Anyone with rudimentary knowledge of good economic theory can explain why government price controls are a bad idea. It boils down to the fact that the optimum price is the price that naturally balances supply and demand, and to the related fact that forcing the price to be above or below the level at which supply and demand would naturally be in balance will lead to either a glut or a shortage. However, even though most people are capable of understanding why price controls are counter-productive, they still want them.

To be clear, most people living in semi-free countries are undoubtedly against the general concept of price controls, but they will be in favour of specific price controls. In a remarkable display of cognitive dissonance, they will simultaneously understand why price controls must cause economic problems and advocate for price controls in certain situations.

They will be in favour of certain price controls due to political leanings or due to being direct beneficiaries of the controls. Here are some examples:

1) Anyone who understands how supply and demand inter-relate should understand that minimum wage laws are not only counter-productive on an economy-wide basis but also cause the most problems for the group of workers they have supposedly been put in place to protect. In particular, it is axiomatic that if government intervention forces the price of labour to be higher than it would otherwise be then the demand for labour will be lower, that is, more people will be unemployed, with the additional unemployment occurring mostly within the ranks of the lowest-skilled workers. For example, if the official minimum wage is $15/hour and someone, due to their lack of experience or skills, is only worth $12/hour, then that person will be out of work. He might be eager to work for $12/hour to gain the experience/training he needs to increase the value of his labour, but the government says: “No; you will either get paid $15/hour or you will be unemployed”.

There are countless people who understand all this and yet strongly support minimum wage laws, either because the laws mesh with their political beliefs or because they personally benefit from the laws.

2) Anyone who understands basic economics should be capable of figuring out that it makes no sense for one of the most important prices in the economy to be set by a banking committee or government agency, and yet most people involved in economics and finance believe that there should be a central bank.

3) It is obvious that “rent control” legislation will lead to a shortage of rental properties and lower average standards of maintenance for existing rental properties, but the current/direct beneficiaries of the legislation (the people who live in rent-controlled housing) will often be in favour of this form of price control.

4) Price caps on utility charges will generally seem like a good idea to the people who currently benefit due to having lower electricity or water bills. That will typically be so even if these people have given the matter enough thought to understand that the artificially-low current prices will lead to less investment in future supply and less maintenance on current plant, leading, in turn, to much higher prices and/or a lower level of service in the future.

5) So-called “anti-price-gouging” laws are invariably popular during disasters, but laws that prevent prices from fully responding to a sudden shortage also reduce the incentive to speedily address the shortage. They therefore prolong the supply problem.

6) Here’s an example that I wasn’t aware of until a couple of weeks ago when I read the article posted HERE. The article discusses a dispute between companies that drill for natural gas in the US and landowners who receive royalty payments in exchange for letting the companies drill on their land. The dispute is about whether the drilling companies are entitled to deduct certain expenses from the royalty payments, but what really caught my attention was the reference to a Pennsylvania state law mandating that a landowner must receive a royalty of at least 12.5 percent of the value of the gas produced on his property.

This law was undoubtedly put in place for the benefit of landowners and most landowners are probably in favour of it, but what it means is that if the price of natural gas isn’t high enough to enable the drilling companies to afford a 12.5% royalty then production will stop and the landowners will get nothing. There’s no scope for the royalty payments to be influenced by natural market forces, although it’s possible that the drilling companies are using deductions to get around the law and reduce the effective royalty rate to a level that is economic at the current gas price.

In summary, very few people are consistently opposed to government price controls. Even people who have enough economics knowledge to understand why price controls never work as advertised find reasons to believe in particular price controls. As a consequence, most of the price controls that are now in place have a lot of supporters among the voting public and are therefore likely to remain in place.

Print This Post Print This Post

Wearing blinders when analysing China

October 5, 2016

Some analysts who are usually astute and show a good understanding of economics seem to put on blinders before looking at China. It’s as if, when considering China’s prospects, they forget everything they know about economics and refuse to see beyond the superficial. A recent example is Doug Casey’s article titled “Chung Kuo“.

Here’s an excerpt from the Casey article:

I can give you a dozen credible scenarios describing what might happen in China over the next couple of decades. But the trend that seems certain to continue is the rapid rate of wealth increase there. I don’t credit official figures with any great accuracy, but if we take them as being approximately right, then the U.S. economy is growing at 2%, and China’s at about 7% — but with a base of about four times the population. What this means is that the largest economy on the planet will soon no longer be America’s — but China’s.

There are two big problems with the above paragraph. First, after saying that he doesn’t credit official figures with any great accuracy he takes these figures as being approximately right. The reality, however, is that China’s reported growth figures are completed fabricated. It’s not that China’s government reports growth of 7.0% when the actual rate of growth is 6.5%; it’s that China’s government reports growth in the 6.5%-7.5% range every year regardless of what’s happening. If the economy were shrinking rapidly the government would still report growth in the 6.5%-7.5% range. Based on other measures of economic activity there have almost certainly been 12-month periods over the past 10 years when China’s economy shrank in real terms, but during these periods China’s government still reported growth of around 7%.

The second problem is that the monetary size of an economy is irrelevant to the people living in it. What matters is per-capita wealth, not aggregate wealth and certainly not aggregate spending (which is what GDP attempts to measure). For example, it’s quite possible that in size terms Nigeria’s economy will overtake Switzerland’s economy within the next few years, but so what? Nobody in their right mind is saying that if this happens then the average Swiss will be worse off than the average Nigerian, because it obviously must be taken into account that there are 175M people in Nigeria and only 8M in Switzerland.

The Casey article then goes on to list some of the things that China has going for it, but most of these things were just as applicable 100 years ago as they are today. Therefore, they aren’t critical ingredients for strong, broad-based economic progress.

Surprisingly, given that Doug Casey’s big-picture analysis is usually on the mark, the Casey article fails to address any of the most important issues. There’s no mention, for example, that China has a command economy with only token gestures towards free markets.

The true colours of China’s economic commanders were shown in 2015 following the bursting of the stock market bubble that they had purposefully created. I’m referring to how they became increasingly draconian in their efforts to stop the price decline. When words of support didn’t work, they made short-selling illegal and began to aggressively buy stocks. When that didn’t work, they forbade corporations and investment funds from selling at all and made it clear that bearish public comments about the stock market would not be tolerated. And when the market still didn’t cooperate, they started apprehending or ‘disappearing’ people suspected of placing bearish bets.

Related to the “command economy” issue is the fact that China has always had an emperor. This means that there is no history of freedom or a culture of individual-rights to fall back on. Furthermore, Xi Jinping, the current emperor (who doesn’t call himself an emperor), has shown admiration for Mao Tse Tung, the most brutal emperor (who also didn’t call himself an emperor) in China’s history.

There’s also no mention in the Casey article that over the past 10 years China has experienced the greatest mal-investment in centuries. You would have to go back to the pyramids of ancient Egypt or the building of the Terracotta Army by China’s first emperor more than 2000 years ago to find comparable examples of resource wastage on such a grand scale.

All the ghost cities, spectacular-but-mostly-vacant shopping malls, barely-used airports and bridges to nowhere have boosted the Keynesian measures of growth — such as GDP — that don’t distinguish between productive and unproductive spending. Consequently, even if the GDP growth figures reported by China’s government bore some resemblance to reality (they don’t), the reported growth wouldn’t be a reason to be optimistic because so much of it is associated with wasteful spending. Moreover, the bulk of the spending is debt-funded by State-controlled banks that would make Deutsche Bank look financially ‘rock solid’ if given a proper accounting treatment.

Next, there’s the legacy of the “one-child policy” to consider. Thanks to decades of the national birth rate being restricted by the giant boot of government, China is now facing a major demographic problem. Specifically, for at least the next couple of decades the number of prime-age workers is going to shrink relative to the elderly.

Finally, it is worth mentioning China’s mind-boggling wealth disparity. A few hundred million people are doing OK and a few million have become extremely wealthy while at least a billion people are living in abject poverty.

As to why some people who produce well-reasoned analysis of what’s happening in the Western world seem incapable of applying the same principles and logic when analysing China, I can only guess. My guess is that they are too focused on trying to show the US in a negative light to see what’s going on in China. It is, however, possible to be concerned about the direction in which the US is heading without being bullish on China.

Print This Post Print This Post

Inflation has always been about theft

October 3, 2016

In 262 AD, plans were being put in place to celebrate the “decennalia” (10 years on the throne) of Roman emperor Gallienus. The following excerpt from the fourth book in Harry Sidebottom’s “Warrior of Rome” series is part of a discussion between Gallienus and his senior advisors regarding how an appropriately-grandiose “decennalia” would be funded:

“The a Rationibus, in charge of the finances of the imperium, did not hesitate. “Celebrating your maiestas is without price and, as you know, Dominus, plans are in place to debase the precious metal in the coinage again. It will be a few months before the merchants catch up.””

In the end Gallienus decides to pay for the celebrations using direct theft (by confiscating and then selling the estates of his enemies and those of their families), but the final sentence of the above excerpt from a work of historical fiction reveals more knowledge of how monetary inflation works than is found in the writings of most Keynesian economists.

Regardless of whether it is implemented via an emperor surreptitiously reducing the precious-metal content of the coinage or by the banking system (the central bank and the commercial banks) creating new currency deposits out of nothing, monetary inflation is a method of forcibly transferring wealth from the rest of the economy to the first users of the new or debased money. In other words, it is a form of theft.

It has always been popular and it has nearly always been effective in the short term because it takes time — potentially a long time — for the people who are having their wealth siphoned away by the inflation to figure out what’s going on. For example, in ancient Rome it took the merchants a few months to catch up following a round of coinage debasement, meaning that it took a few months for prices to adjust to the reduced value of the money. These days it takes much longer, because there is no observable difference between the currency units that are being issued today and the ones that were issued in the past. In fact, these days most people never figure out why they are finding it increasingly difficult to make ends meet.

Just to be clear, if monetary inflation caused a nearly-immediate and uniform increase in prices throughout the economy then it would never have been popular. From the perspective of the ‘inflators’ it would serve no purpose, because it would not enable a small minority to benefit at the expense of the majority. It is only popular because it boosts some prices relative to other prices, thus temporarily benefiting some parts of the economy at the expense of other parts, and because the early users of the new money get to do the bulk of their spending/investing before prices rise.

As mentioned above, these days it is not possible to directly observe the debasement of money. Also, the populace is regularly told that “inflation” is not only not a problem, there isn’t enough of it! As a consequence, knowledge of good economic theory is required to understand what’s happening to money and why slower economic progress, or even a prolonged economic contraction, will be an inevitable result.

Unfortunately, hardly anyone has this knowledge, so most people’s minds are open to the propaganda that central banks are providing genuine support to the economy and that a more interventionist government could help make things better.

Print This Post Print This Post

A strange sentiment conflict

October 1, 2016

This blog post is a excerpt from a recent TSI commentary.

As the name suggests, the weekly American Association of Individual Investors (AAII) sentiment survey is an attempt to measure the sentiment of individual investors. The AAII members who respond to the survey indicate whether they are bullish, neutral or bearish with regard to the US stock market’s performance over the coming 6 months. The AAII then publishes the results as percentages (the percentages that are bullish, neutral and bearish). The Consensus-inc. survey is a little different in that a) it is based on the published views of brokerage analysts and independent advisory services and b) the result is a single number indicating the bullish percentage. However, the results of both surveys should be contrary indicators because in both cases the surveyed population comes under the broad category affectionately known as “dumb money”.

In other words, in both cases it would be normal for high bullish percentages to occur near market tops (when the next big move is to the downside) and for low bullish percentages to occur near market bottoms (when the next big move is to the upside). That’s why the current situation is strange.

With the S&P500 Index (SPX) having made an all-time high as recently as last month and still being within two percent of its high it would be normal for sentiment to be near an optimistic extreme. As evidenced by the blue line on the following chart, that’s exactly what the Consensus-inc survey is indicating. However, the black line on the following chart shows that the AAII survey is indicating something very different. Whereas the Consensus-inc bullish percentage is currently near the top of its 15-year range, as would be expected given the price action, the AAII bullish percentage is currently near the BOTTOM of its 15-year range. According to the AAII sentiment survey, individual investors are only slightly more bullish now than they were at the crescendo of the Global Financial Crisis in November-2008.

The conflict between the AAII survey results and both the price action and the results of other sentiment surveys (the AAII survey is definitely the ‘odd man out’) suggests that small-scale retail investors have, as a group, given up on the stock market and are generally ignoring the bullish opinions of mainstream analysts and advisors. We are pretty sure that a similar set of circumstances has not arisen at any time over the past 40 years, although it may well have arisen during an earlier period.

The lack of interest in the stock market on the part of small-scale individual investors could be construed as bullish, but we don’t see it that way. To us, the fact that the market has come this far and reached such a high valuation without much participation by the “little guy” suggests that the cyclical bull market will run its course without such participation. It also suggests to us that the cyclical bull market is more likely to end via a gradual rolling-over than an upside blow-off, because upside blow-offs in major financial markets require exuberance from the general public.

Print This Post Print This Post