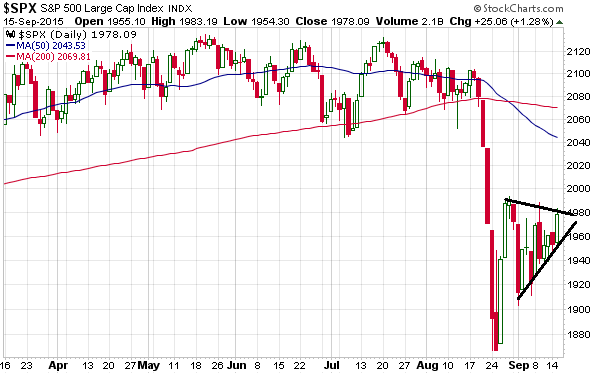
I’ve placed a small bet (via put options) that the senior US stock indices will drop to test their 24th August lows by mid-October. At the same time I acknowledge the potential for a sharp move to the upside over the next 2-3 days in anticipation of and in reaction to the Fed’s 17th September interest-rate decision. That’s why my bearish bet is small.
The chart pattern of the S&P500 Index (SPX) suggests that there will be a sharp move over the days immediately ahead, although it doesn’t point to a particular direction. One possible outcome involves an upside breakout within the next two days from the contracting triangle drawn on the following chart and then a downward reversal. This is the near-term outcome that would confuse the greatest number of traders, which is why I favour it.
I never risk money on guesses about what any financial market is going to do over time periods as short as a few days, but it’s still fun to guess.
 Print This Post

