The only commodity supply-demand indicator that matters

February 22, 2017

For an industrial commodity with a liquid futures market, the “term structure” of the futures market is the most useful — perhaps even the only useful — indicator of whether physical supply is tight, abundant or somewhere in between.

The term structure of a commodity futures market is the prices of futures contracts for the commodity over all available expiration months. It can be displayed as a chart, with price along the vertical axis and the expiration months along the horizontal axis. Here are examples for oil and copper.

oil_term_210217

copper_term_210217

If a market is in “contango” then the later the delivery month the higher the price, resulting in the chart of the term structure being an upward-sloping curve. If a market is in “backwardation” then the earlier delivery months will have the higher prices and the term structure will be represented by a downward-sloping curve. It is also possible for the curve representing the term structure to have an upward slope over some future delivery periods and a downward slope over others. This often happens with commodities that experience large seasonal swings in production (e.g. grains) or consumption (e.g. natural gas), but it can also happen with other commodities.

For an industrial commodity such as oil or copper it will be normal for the term-structure curve to slope upwards, that is, for the market to be in “contango”, with the extent of the “contango” reflecting the cost of physical-commodity storage. To further explain, let’s say you are a large-scale commercial consumer of oil and you estimate that you will need X barrels of the stuff in August of this year. In this case, if you don’t want to assume any price risk you can either take delivery of physical oil immediately and store it until August or buy oil for delivery in August (August-2017 oil futures). It will make sense to buy the physical oil if the cost of storage and financing is less than the premium over the spot (cash) price that you would have to pay for the August futures contracts. Otherwise, it will make sense to buy the futures and take delivery when the oil is needed in August.

It is, however, possible for a commodity such as oil to go into backwardation, that is, for the later delivery months to trade at a discount to the earlier delivery months and the spot price. Such a situation would create a risk-free profit for a commercial trader with excess oil on hand (“excess oil” being oil that will be needed by the trader in the future but isn’t needed immediately), because the trader could sell his excess physical supply on the spot market and lock-in his future supply needs by purchasing futures contracts at a discount to spot. In doing so he would not only pocket the difference between the spot and futures prices, he would also save on storage costs.

Due to the attractive arbitrage opportunity that would be presented by backwardation, it’s a situation that will usually arise only if there’s a shortage of currently-available physical supply. Backwardation, or a downward-sloping term-structure curve, is therefore a clear sign that the physical market is tight. By the same token, if the physical supply situation is genuinely tight then the market will either be in backwardation or the positive slope of the term-structure curve will be much gentler than usual.

Sometimes the term-structure curve will have a steeper upward slope than usual, that is, the later delivery months will trade at larger-than-usual price premiums to the earlier delivery months and the spot price. This will create an opportunity for traders to make risk-free profits by selling the futures and buying the physical, unless there is presently so much physical supply bidding for storage space that the price of storage is high enough to eliminate the potential arbitrage profit. Since risk-free arbitrage opportunities tend to be fleeting, a term-structure curve with a sustained steeper-than-usual upward slope indicates an abundance of currently-available physical supply.

Looking at the “term structure” charts displayed above, it is apparent that the fundamental backdrop is currently supportive for the oil price. This, by the way, constitutes a significant bullish change over the past 1-2 months. It is also apparent that the fundamental backdrop is neutral for the copper price, in that the “term structure” for the copper market has a fairly normal upward slope. The copper market appears to be adequately supplied at this time, although a more thorough analysis would take into account the LME term structure in addition to the COMEX term structure.

What about the reported inventory levels for commodities such as oil and the base metals? Is this information useful?

In general, no, because a lot of aboveground supply is not held in the storage facilities that are covered by such reports. There will be times when a relative shortage or abundance of physical supply is correctly signaled by the widely-reported inventory levels, but in such cases the evidence of shortage or abundance will also appear in the “term structure”. And the “term structure” will be more reliable, meaning that it will generate fewer false signals.

A final point worth making is that a bearish supply-demand situation doesn’t necessarily mean that the price will fall and a bullish supply-demand situation doesn’t necessarily mean that the price will rise. For example, in January-February last year I wrote that a strong rally in the oil price would probably soon begin even though oil’s supply-demand situation was as price-bearish as it ever gets. Part of my reasoning was that with the oil price having already dropped to near a 50-year low in real terms, the worst-case scenario had been factored into the current price. Also, after the fundamentals become as bearish (or bullish) as they ever get, what’s the most likely direction of the next move?

Print This Post Print This Post

Trump will not really cut taxes

February 20, 2017

As the financial world waits with bated breath for details of Donald Trump’s “phenomenal” tax plan, it’s important to understand that regardless of what Trump announces on the tax front there will be no genuine tax cut. The reason is that for a tax cut to be genuine it must be funded by reduced government spending.

Tax cuts are unequivocally beneficial to the economy if they are genuine, but if a tax cut isn’t funded by reduced government spending, that is, by the government consuming less resources, then one way or another it will have to be funded by the private sector. It will just be another Keynesian stimulus program, and like all Keynesian stimulus programs it will potentially boost economic activity in the short-term at the cost of slower long-term progress.

It should be obvious that the private sector cannot benefit from a tax cut that it will have to pay for, but apparently it isn’t obvious because most people seem to believe that the government can consume more resources and at the same time the private sector can end up with more resources. This is an example of believing the impossible. Unfortunately, it’s not the only such example in the world of economics, in that many aspects of Keynesian theory involve belief in the impossible.

The cost of government is determined by what the government spends, not how much it collects in taxes. And we can be sure that during the next four years there is going to be a large rise in the cost of the US federal government, meaning that with or without a so-called tax cut the private sector (as a whole) is destined to end up with reduced resources under the Trump regime. We can also be sure that it would have ended up with reduced resources under a Clinton regime.

The reason, as explained in the article posted at http://crfb.org/papers/lame-duck-president-2017, is that spending increases in excess of revenue increases were ‘baked into the cake’ prior to the November-2016 Presidential election thanks to budgets dictated by previous presidents and Congresses. Getting a little more specific, the linked article points out that 150 percent of new revenue a decade from now is pre-committed to spending growth scheduled under laws that were in place prior to the 2016 election. Moreover, this should be viewed as an unrealistically-optimistic forecast because it assumes steady inflation-adjusted revenue growth. A more realistic forecast would account for the sizable decline in inflation-adjusted revenue that will be caused by a recession within the next few years.

The bottom line is that any cuts in the rates of US individual and corporate income taxes announced/implemented over the coming 12 months will be ‘smoke and mirrors’, because government spending is going to increase. It will essentially be a money-shuffling exercise to temporarily create the illusion that the burden of government is shrinking at the same time as it is growing.

Print This Post Print This Post

An age-old relationship between interest rates and prices

February 15, 2017

The chart displayed near the end of this discussion is effectively a pictorial representation of what Keynesian economists call a paradox* (“Gibson’s Paradox”) and Austrian economists call a natural and perfectly understandable relationship.

Gibson’s Paradox was the name given by JM Keynes to the observation that interest rates during the gold standard were highly correlated to wholesale prices but had little correlation to the rate of “inflation”, that is, that interest rate movements were connected to the level of prices and not the rate of change in prices. It was viewed as a paradox because most economists couldn’t explain it. According to conventional wisdom, interest rates should have been positively correlated with the rate of “price inflation”.

The problem is that most economists did not — and still do not — understand what interest rates are.

First and foremost, interest rates are the price of time. They reflect the fact that, all else being equal, humans place a higher value on getting something now than on getting exactly the same thing at some future time. Interest rates transcend money, because they exist even when money does not. With or without money and all else being equal, getting something now will always be worth more than getting the same thing in the future**. This is called time preference.

Time preference is the root of interest rates and the natural interest rate is a measure of societal time preference. That is, the natural interest rate is a measure of the general urgency to consume in the present or the amount that would have to be paid, on average, to make saving (the postponement of consumption) worthwhile. For example, the average 7-year-old child has a very high time preference, in that if you give the kid a choice between getting a desirable toy today or getting something more in 3 months’ time, the “something more” option won’t be chosen unless it is a LOT more, whereas a middle-aged adult with substantial savings is likely to have low time preference.

When interest rates are properly understood it becomes clear that the paradox named after Gibson is no paradox at all. The reason is that if the money is sound, as it mostly was under the Gold Standard, both interest rates and prices will move in the same direction in response to changes in societal time preference.

To further explain, during a period of rising time preference, that is, during a period when there is an increasing desire to consume in the present, the prices of goods will rise (on average) due to increasing demand and it will take a higher interest rate to encourage people to delay their spending. During a period of falling time preference, that is, during a period when there is an increasing desire to save, the prices of goods will fall (on average) and people will generally accept a lesser incentive (interest rate) to delay their spending.

In a nutshell, there is no paradox because, when the money is sound, interest rates don’t drive prices and prices don’t drive interest rates; instead, on an economy-wide basis*** both prices and interest rates are driven by changes in societal time preference.

That’s all well and good, but we no longer have sound money. Moreover, we have massive, continuous manipulation of interest rates by central banks. The signal that interest rates should send is therefore now being overwhelmed by central-bank-generated noise to the point where it’s a miracle (a testament to the resilience of entrepreneurial spirit, actually) that we still have a functioning economy. Quite remarkably, though, signs of the age-old relationship between interest rates and the price level can still be found if you know where to look.

The signs aren’t apparent when interest rates are compared with an official wholesale price index, because a great effort is expended by the central planners to ensure that the official money loses purchasing power year-in and year-out regardless of what’s happening in the world. However, the signs are apparent when interest rates are compared to a wholesale price index based on gold.

The commodity/gold ratio is the price of a broad-based basket of commodities in gold terms. In essence, it is a wholesale price index using gold as the monetary measuring stick. Although gold is no longer money in the true meaning of the term (it is no longer the general medium of exchange), it is still primarily held for what can broadly be called ‘monetary purposes’ and in many respects it trades as if it were still money. According to the age-old relationship discussed above and labeled “Gibson’s Paradox” by a confused JM Keynes, the commodity/gold ratio should generally move in the same direction as risk-free interest rates.

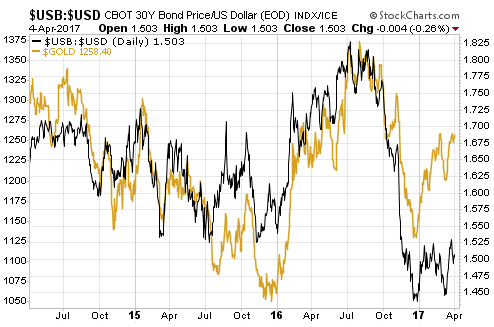
The risk-free US interest rate that is least affected by the direct manipulation of the Fed is the yield on the 30-year T-Bond, so what we should see is a positive correlation between the commodity/gold ratio and the T-Bond yield. Or, looking at it from a different angle, what we should see is a positive correlation between the gold/commodity ratio and the T-Bond price. That’s exactly what we do see.

Using the Goldman Sachs Spot Commodity Index (GNX) to represent commodities, the following chart shows that the age-old relationship has worked over the past 10 years when gold is the monetary measuring stick. It has also worked over the past 20 years, although there was a big divergence — possibly due to the ‘China effect’ on commodity prices or the ECB’s aggressive money pumping — in 2005.

I like this chart because it makes economic sense and because it can be helpful when trying to anticipate the next important turning point for the gold/commodity ratio and/or the T-Bond.

GCvsUSB_140217

*As a general rule, if your theory leads to a paradox then your theory is wrong.

    **There are many real-life examples of a premium being paid to receive a good in the future rather than the present, but in such cases all is not equal. That is, in such cases there will be a difference between the future good and the present good that makes the future good more valuable. For example, an oil refiner will generally pay more for a barrel of oil to be delivered in six months’ time than a barrel of oil to be delivered immediately, because if it doesn’t plan to refine the oil until 6 months from now it can save 6 months of storage costs by purchasing oil for future delivery. To put it another way, in this oil-refiner example a barrel of oil for immediate delivery is priced at a discount because it comes with 6 months of storage-related baggage.

    ***For any specific interest-rate-related transaction, credit risk will be very important. As a result, at any given time there will be a wide range of interest rates within an economy even if the money has no “inflation” risk. However, it is reasonable to think of time preference as an interest-rate floor that rises and falls. In effect, time preference determines the interest rate that would apply on average throughout the economy if there were no credit or inflation risks.

Print This Post Print This Post

A trade deficit is never a problem

February 13, 2017

It’s not just Donald Trump. Many political leaders around the world operate under the misconception that a trade deficit is a problem to be reckoned with. This misconception has been the root of countless bad policies over the centuries.

Trade, by definition, is not an adversarial situation resulting in a winner and a loser. Rather, both parties believe that they are benefiting, otherwise the trade would not take place. Most of the time, both parties do benefit. In general, one side wants a particular product more than a certain quantity of money and the other side wants the quantity of money more than the product. When the exchange takes place, both sides get the thing to which they assign the higher value at the time.

All the hand-wringing about international trade deficits is based on the ridiculous notion that the side receiving the money is the winner and the side receiving the product is the loser, but how could this be? If the side receiving the product was losing-out then it wouldn’t enter into the trade. Furthermore, given that today’s money is created out of nothing, if a trade were to be viewed as a win-lose situation then surely it’s the side receiving the product that should be viewed as the winner.

That being said, I don’t want to confuse the argument by asserting that it makes sense to view the side receiving the product as the winner in the exchange of money for product. Both sides are winners, because both sides get what they prefer at the time of the exchange.

For example, if you shop at Wal-Mart then you run a trade deficit with Wal-Mart. Is this trade deficit a problem for you? Obviously not, otherwise you wouldn’t shop there. Would it make sense for the government to step in and slap a tax on all Wal-Mart products, thus forcing you to buy less products from Wal-Mart and thereby reducing your trade deficit with that company?

Some will claim that a trade deficit is only a problem when it happens between different countries, but countries aren’t entities that trade with each other. People trade with each other, and political borders don’t determine what is and isn’t economically beneficial. If John and Bill have been trading with each other for years to their mutual benefit within the same political region, placing a political border between them wouldn’t mysteriously alter the mutually-beneficial nature of their trading.

Another point that should be understood is that a “trade deficit” for a country results in an investment surplus for that country. The reason is that the monetary surplus on the trade account doesn’t disappear or get placed under a mattress, it gets invested in securities (stocks and bonds), real estate, businesses and projects. A trade deficit therefore isn’t associated with a net flow of money out of the economy, it is associated with a re-routing of money within the economy. There is no good reason to expect that this re-routing will lead to a net loss of jobs. In fact, the opposite is the case.

Unfortunately, while a so-called trade deficit is not a problem, the taxes, tariffs, subsidies and other government measures that are implemented to reduce a trade deficit definitely do cause problems.

Print This Post Print This Post

Charts of Interest

February 10, 2017

Here are a few of the charts that currently have my attention:

1) The industrial metals bottomed (in price) as a group early last year. They were then led higher as a group by iron-ore, the metal that according to many analysts had the most bearish fundamentals and could therefore not sustain a rally.

The following chart (from barchart.com) shows that the iron-ore price has more than doubled since its early-2016 bottom. It made a marginal new high this week, so there is no evidence yet that the rally is over.

When the iron-ore price eventually reverses it will be a warning that the broad-based industrial-metals rally is close to an end.

ironore_090217

2) The following chart compares the euro with the difference in yield between 10-year German Government bonds and 10-year US Treasury notes. The euro has tracked this interest-rate differential quite closely over the past two years and very closely over the past 6 months.

The implication is that for the euro to extend its short-term rebound, German yields will have to remain in an upward trend relative to US yields. How likely is that?

euro_yielddiff_090217

3) The Dow Transportation Average (TRAN) traded comfortably above its November-2014 high during December-2016 and January-2017, but in each case it failed to give a monthly close above the November-2014 close. This means that TRAN still hasn’t broken above its 2014 peak on a monthly closing basis, which represents an interesting non-confirmation of the breakouts achieved by other indices.

Will TRAN finally break out on a monthly basis this month?

TRAN_090217

4) In early-July of last year the Commitments of Traders (COT) data indicated that speculators were as bullish as they ever get on long-dated Treasury securities. This set the stage for an important price top. By December the sentiment situation had shifted 180 degrees, with the COT data indicating that speculators were as bearish as they ever get on long-dated Treasury securities. The stage was therefore set for an important price bottom.

The recovery from the December-2016 bottom is probably not yet close to being over.

TLT_090217

Print This Post Print This Post

The illogical world of GATA

February 8, 2017

In response to the 3rd January blog post in which I pointed out the straightforward fact that evidence of market manipulation is not necessarily evidence of price suppression, a reader sent me a link to a year-old GATA article. The GATA article was presented by the reader as a refutation of what I had written.

It is certainly possible to construe the aforelinked GATA article as having at least partly refuted what I wrote, but only if you take the article’s headline (“State Dept. cable confirms gold futures market was created for price suppression”) and conclusion (“…[the cable confirms] the assertions by GATA and others in the gold-price suppression camp that futures markets function largely as mechanisms of commodity price suppression and support for government currencies”) at face value and give no further thought to what is being presented and asserted.

However, if you take the time to read the excerpt from the 1974 State Dept. cable included in the GATA article you will see that it does NOT say that the gold futures market was created for price suppression; it says that re-legalising private gold ownership in the US (it had been illegal since 1933) would result in the formation of a large and liquid futures market. In effect, it says that the formation of a futures market would be a natural consequence of the gold market becoming freer.

The State Dept. cable does express an opinion that large-volume futures dealing would create a highly volatile market, and that the volatile price movements would diminish the initial demand for physical holding and most likely reduce the long-term hoarding of gold by U.S. citizens. This opinion is certainly debatable, as a good argument can be made that futures markets tend to bring about LESS long-term volatility in the price of a commodity. In any case, it is just an opinion as to the price-related consequences of a naturally-occurring futures market.

It is also worth mentioning that the cable is from an embassy bureaucrat with no say in government policy.

So, in no way does the State Dept. cable do what the author of the GATA article claims it does. Moreover, the assertion that “futures markets function largely as mechanisms of commodity price suppression and support for government currencies” is not only in no way backed-up by the evidence presented, it is so illogical as to be laughable. There have been futures markets for many widely-traded commodities for hundreds of years. These markets were not created by and do not exist for the benefit of governments.

Sometimes, no specialised knowledge is needed to figure out that a conclusion doesn’t follow from the information presented. For example, detailed knowledge of the gold futures market is not needed to see that the State Dept. cable cited in the GATA article does not come remotely close to confirming GATA’s assertions. Sometimes, all that’s needed is a modicum of logic.

Print This Post Print This Post

Regime Uncertainty

February 6, 2017

In a blog post last Friday I provided evidence that the extent to which a US president is “pro-business” has very little to do with the stock market’s performance during that president’s term in office. Regardless of whether the associated policies are good or bad for the economy, the key to the stock market’s performance over the course of a presidency is the market’s position in its long-term valuation cycle. On this basis there’s a high probability that the stock market’s return over the course of Trump’s first — and likely only — 4-year term will be dismal, no matter what Trump does. However, the policies of a president can have a big effect on the performance of the economy.

It’s obviously early days for the Trump Administration, but the initial signs are not positive. The main reason is that “regime uncertainty” is on the rise.

“Regime uncertainty” is the name given to the tendency of private investors to pull back from making long-term financial commitments due to uncertainty about what the government will do next. According to an essay by Robert Higgs, it was one of the factors that prolonged the Great Depression of the 1930s. Government intervention is generally bad for the economy, but it tends to be even worse when it happens in an ad hoc way.

As discussed in a Bloomberg article last month, the economically-depressing effect of government by ad-hoc command was also addressed by Friedrich Hayek in “The Road to Serfdom”. The problem, in a nutshell, is that if the government’s actions are predictable then people are able to plan, but if officials are regularly issuing commands it will become much harder for people to have the kind of security that is a precondition for economic development and growth.

The signs were not good when Trump started singling-out individual companies for special treatment even before he took the oath of office and got worse when Trump started talking about imposing a 20% tax on Mexican imports as a way of forcing Mexico to pay for a wall between the two countries. Does he really believe that forcing US consumers to pay 20% more for products made in Mexico amounts to making Mexico pay for the wall?

And the signs recently became more worrisome due to the sudden imposition of immigration and refugee bans. The effects of these bans on the US economy will not be significant, but the concern is what they imply about the decision-maker’s level of understanding and willingness to ‘shoot from the hip’.

The immigration ban imposed on seven Muslim-majority countries is a particular concern because of its blatant irrationality. Making America safe from terrorism is the official justification for the action, but over at least the past 40 years there has not been a single fatal terrorist attack perpetrated on US soil by anyone from any of the banned countries. On the other hand, Saudi Arabia is not covered by the ban despite having supplied 15 of the 19 terrorists directly involved in the 9/11 attacks and being well known as a state sponsor of terrorist organisations. I am not suggesting that the ban should be expanded to include other countries, I am questioning the knowledge and logicalness of a political leader who would decide to do what has just been done.

To top it all off, late last week Trump began threatening Iran for no good reason via his preferred medium for conducting international diplomacy: Twitter. What will he do next?

Taking a wider angle view, the protectionist agenda that the Trump Administration seems determined to implement will have numerous adverse consequences, most of which aren’t quantifiable at this time because it isn’t known exactly what measures will be taken and how other governments will react. All we know for sure is that Trump wrongly believes that international trade is a win-lose scenario and that trade deficits are problems for governments to actively reckon with.

Perhaps the initial warning signs are not indicative of what’s to come and Team Trump will settle into a more logical, impartial and cool-headed approach, but right now it looks like Donald Trump is going to make uncertainty great again. If so, private investment will decline.

Print This Post Print This Post

A pro-business government does NOT lead to a stronger stock market

February 3, 2017

Putting aside the fact that prior to the US Presidential election last November almost everyone believed that a Trump victory would result in a weak stock market, the popular view now is that the stock market has strengthened since the election due to the incoming Trump Administration being more pro-business. It is arguable whether the Trump Administration really will be “pro-business” (early signs are that it won’t be), but in any case the historical record indicates that the currently-popular view is total nonsense.

According to the historical record, the stock market’s performance during a Presidential term has nothing to do with the extent to which the Administration is pro-business. Let’s consider some examples to help make this point, using the Dow Industrials Index as our stock-market proxy and the November election dates as the starting and ending points of a presidential term. It makes sense to use the election dates rather than the inauguration dates given that the financial markets will begin to discount the economic effects of a new president immediately after the election result is known.

First, F.D.Roosevelt probably led the most anti-business administration in US history, but during FDR’s first 4-year term the stock market had a phenomenal gain of about 160%.

Second, Ronald Reagan was supposedly a very pro-business president, but during his first 4-year term the stock market gained only 26%. The stock market’s gain during Reagan’s first term was not only a tiny fraction of the gain achieved during FDR’s first term, it was also less than the roughly 40% gain achieved during the first term of the supposedly anti-business Obama Administration.

Third, the stock market did much better during Reagan’s second term, enabling Reagan to chalk up an 8-year stock-market return of about 120%. This, however, wasn’t substantially better than the 90% gain chalked up by the anti-business Obama and pales in comparison to the 240% gain achieved by the Dow over the course of Bill Clinton’s two terms.

Fourth, two of the worst stock-market performances occurred during the supposedly pro-business administrations of Herbert Hoover and GW Bush. The Dow was down by a little more than 10% over the course of GW Bush’s two terms and by an incredible 70+% during Hoover’s single term in office.

To summarise the above, the historical record isn’t consistent with the view that a more pro-business President results in a stronger stock market.

There are, of course, a number of influences on how the stock market performs during any presidential term, including the amount of domestic monetary inflation and what’s happening throughout the world. One influence, however, dominates all others. That influence is the point in the valuation cycle at which a presidential term starts and ends. The reality is that some presidents get lucky with timing, others don’t.

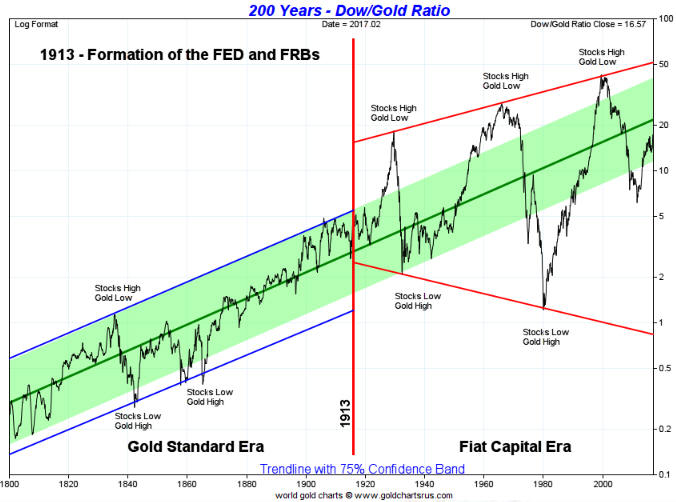
I’ll explain what I mean with the help of the following long-term Dow chart. The chart was created by Nick Laird at goldchartsrus.com, but I added the red notes to indicate the first election victories of various presidents.

Dow_LT_Pres_020217

The above chart shows that when it comes to the gains achieved by the stock market during a presidency, timing is critical. For example, despite FDR implementing a set of policies that were economically disastrous, the stock market rocketed upward during his first term because at the start of the term the Dow was well below the bottom of its long-term channel. However, by the start of FDR’s second term the Dow had recovered to near the middle of its long-term channel, resulting in much weaker subsequent performance. For another example, there is no doubt that Hoover and GW Bush were terrible presidents, but they were certainly no worse than their successors and yet the stock market’s performance was relatively dismal during their presidencies. This is mainly because their presidencies began with the Dow above the top of its long-term channel.

Trump’s presidency is beginning with the Dow at the top of its long-term channel. This pretty much guarantees that the US stock market’s performance over the course of the next 4 years will be dismal, regardless of whether or not Trump’s policies are “pro-business”.

Print This Post Print This Post

Loosening is the new tightening

January 31, 2017

[This post is an excerpt from a TSI commentary published two days ago]

The Fed meets to discuss its monetary policy this week. There is almost no chance that an outcome of this meeting will be another boost in the Fed Funds Rate (FFR), but there’s a decent chance that the next official rate hike will be announced in March. Regardless of when it happens and regardless of how it is portrayed in the press, the next Fed rate hike, like the two before it, will NOT imply a tightening of US monetary policy/conditions.

The two-part explanation for why hikes in the FFR no longer imply the tightening of monetary policy has been discussed many times in TSI commentaries over the past few years and was also addressed in a March-2015 post at the TSI Blog titled “Tightening without tightening“. The first part of the explanation is that with the US banking system inundated with excess reserves there is no longer an active overnight lending market for Federal Funds (banks never have to borrow Federal Funds anymore because they have far more than they require). In other words, when the Fed hikes the FFR it is hiking an interest rate that no one uses.

The second and more important part of the explanation is that Fed rate hikes are now implemented by increasing the interest rate PAID by the Fed on bank reserves. That is, Fed rate hikes are now implemented not by charging the banks a higher rate of interest but by paying the banks a higher rate of interest. To put it another way, whereas in the “good old days” rate hikes were implemented by removing reserves from the banking system, the Fed now implements rate hikes by injecting reserves — in the form of interest payments — into the banking system.

So, what’s widely known as monetary tightening is now a Federal Reserve action that actually has the effect of LOOSENING monetary conditions.

Orwell’s “1984″ had the slogans “War is Peace”, “Freedom is Slavery” and “Ignorance is Strength”. Thanks to the Fed we can now add “Loosening is Tightening”.

Print This Post Print This Post

Gold and the US Constitution

January 25, 2017

The US Constitution is often held up as an ideal to be aspired to, but it is actually far from ideal.

One reason it is far from ideal is that the section setting out the powers of Congress (Article 1 Section 8) is too general. For example, it gives Congress the power to “lay and collect Taxes, Duties, Imposts and Excises, to pay the Debts and provide for the common Defence and general Welfare of the United States.” The terms “Taxes” and “general Welfare” had different (much narrower) meanings back then, but it’s not hard to understand how this statement could be construed to justify much of the growth in the federal government over the ensuing 200+ years. Another example concerns money. The Constitution gives Congress the power to “coin Money [and] regulate the Value thereof.” It’s not hard to understand how the words “coin Money” could be interpreted to mean “create Money”, since “coin” and “create” (in reference to money) were effectively the same thing when the Constitution was penned.

It is often claimed that the Constitution requires money to be gold or silver coin, but this is not the case. The only mention of gold or silver is in the section that sets out the limitations on the powers of individual states (Article 1 Section 10). This section prohibits any State from making “any Thing but gold and silver Coin a Tender in Payment of Debts”, but imposes no restrictions on the power of Congress to coin money and regulate the value thereof.

Should the Constitution have been much clearer in defining money as gold and/or silver?

The answer is no, because the government should not have the right to determine what is and isn’t used as money by private individuals. The Constitution should simply have forbidden the government from having anything to do with money. In particular, rather than empowering the government to coin money and regulate the value thereof it should have prohibited the government from exerting any influence over the supply or value of money.

What is/isn’t money should be chosen by ‘the market’. It’s likely that the market would choose gold and/or silver if it were free to make the choice, but the freedom to choose something other than a precious metal should always be available. That’s why a “Gold Standard” is not a worthwhile objective. The government doesn’t have the legitimate right to impose gold as money any more than it has the legitimate right to impose pieces of paper as money.

The US Constitution opened the door to much of what happened later. It’s therefore likely that if the writers of the Constitution had the chance to do it over again knowing what is known today, they would cobble together a very different document.

Print This Post Print This Post