There will be a ‘V’ recovery…sort of

May 26, 2020

[This blog post is an excerpt from a commentary posted at TSI last week]

The rebound from the H1-2020 plunge into recession probably will look like a ‘V’, at least initially. This is not because conditions will become positive as quickly as they became negative, but because conditions got so bad so quickly that charts of economic statistics such as industrial production and retail sales will appear to make a ‘V’ bottom in Q2-Q3 of this year. However, the ‘V’ won’t mark the start of a genuine recovery.

The following charts show what we mean by “got so bad so quickly”.

The first chart shows that within the space of three months the Small Business Optimism Index collapsed from a level that indicated a high level of optimism to one of the lowest levels in the 34-year history of the index. The only other decline of this magnitude occurred during the 2005-2008 period and took more than two years.

The second chart shows that Industrial Production has just registered its largest month-over-month decline in at least 101 years. By this measure, even the worst months of the Great Depression were not as bad as April-2020.


Source: dshort


Source: Hedgeye

There are thousands of people who have lost their businesses — in some cases, businesses that they spent the bulk of their adult lives building — over the past two months as a result of the lockdowns. These people probably are feeling angry and/or devastated. However, we get the impression that the vast majority of people have accepted the lockdowns with equanimity. They haven’t taken to the streets to protest the economic destruction that has been wrought by their political overlords. Instead, they have shrugged off the most rapid decline in industrial production in history and a sudden rise in the unemployment rate from below 4% to above 20%. How is this possible?

It’s possible only because the government and the Fed have showered the people with money. The money that has been created out of nothing is acting like pain-suppressing medication. In effect, the government and the Fed have administered anaesthetic so that the patient felt no pain as vital organs were removed. Without this anaesthetic, the populace would not have remained docile as its basic rights were cancelled and its economic prospects were greatly diminished.

Money, however, is just the medium of exchange. It facilitates the division of labour*, but it does not constitute real wealth. For example, if every current dollar were instantly replaced by ten dollars, there wouldn’t be any additional wealth. The point is that the government and the Fed cannot make up for the decline in real wealth caused by the lockdowns by providing more money. All they can do is change the prices of the wealth that remains.

There will be a ‘V’ shaped recovery, but due to the destruction of real wealth stemming from the lockdowns the rising part of the V is bound to be much shorter than the declining part of the V. This will lead to a general realisation that life for the majority of people will be far more difficult in the future than it was over the preceding few years.

Returning to our medical analogy, eventually the anaesthetic will wear off and the patient will have to start dealing with the consequences of having lost a kidney, a spleen, a lung and half a liver.

*In the absence of money, a tomato farmer who needed some dental work would have to locate a dentist who needed a few crates of tomatoes.

Print This Post Print This Post
The monetary inflation moonshot

May 18, 2020

[This blog post is a modified excerpt from a recent TSI commentary]

At around this time last month we noted that the Fed had pushed the year-over-year rate of growth in US True Money Supply (TMS)*, also known as the US monetary inflation rate, to a multi-year high of 11.3%, and that based on what the Fed subsequently had done the monetary inflation rate could reach 15%-20% by the middle of this year. With the monthly monetary data for April having been published last week, we now know that the aforementioned range has been reached already. As illustrated below, as at the end of April the US monetary inflation rate was close to 20%. Next month’s rate should be even higher.

This is banana-republic-style money creation, although it isn’t unprecedented for the US. The above chart shows that a near-20% monetary inflation rate also was attained in January-2002. Back then it was the bursting of the stock market bubble followed by the 9/11 attacks that caused the Fed to panic and flood the financial system with new money.

In a way, the shock to the financial markets resulting from the attacks by terrorists in September-2001 is similar to the shock to the financial markets resulting from the COVID-19 lockdowns. That’s despite the huge differences in the economic ramifications (the damage inflicted on the overall economy by the 9/11 attacks was minor and short-term, whereas the damage inflicted on the overall economy by the virus-related lockdowns of 2020 will prove to be major on both a short-term basis and a long-term basis).

The similar reactions of the financial markets (most notably the stock market) to the events of 2001 and 2020 firstly can be put down to the fact that both situations involved a sudden increase in uncertainty. Investors and speculators knew that the world had changed for the worse, but were ‘in the dark’ regarding many of the details. Secondly, in both cases there was an immediate and aggressive attempt by policy-makers to ‘reflate’.

Some of the results of this year’s monetary inflation moonshot should be similar to the results of the 2001 episode. In particular, this year’s explosion in the supply of US dollars should lead to a weaker US$ on the foreign exchange market (the Dollar Index commenced a multi-year bearish trend in January-2002 and probably will do the same within the next few months), a higher gold price, higher commodity prices and — eventually — higher equity prices.

The most important difference is that over the years ahead the economy will stay weak and, as a result, the unemployment rate will stay high. This is because flooding the economy with new dollars not only does nothing to make up for the destruction of real wealth caused by the lockdowns, it gets in the way of wealth creation by falsifying price signals and keeping ‘zombie companies’ alive.

*TMS is the sum of currency in circulation, demand deposits and savings deposits. It does not include bank reserves, time deposits or money market funds.

Print This Post Print This Post
The status of gold’s “true fundamentals”

May 12, 2020

According to my Gold True Fundamentals Model (GTFM), the gold market’s “true fundamentals” most recently shifted from bearish to bullish in December of last year. As indicated on the following weekly chart by the blue line being above 50, at the end of last week they were still bullish. This means that the fundamental backdrop is still applying upward pressure to the gold price.

GTFM_120520

As previously explained, I use the term “true fundamentals” to distinguish the fundamentals that actually matter from the largely irrelevant issues that many gold-market analysts and commentators focus on.

According to many pontificators on the gold market, gold’s fundamentals include the volume of metal flowing into the inventories of gold ETFs, China’s gold imports, the amount of “registered” gold at the Comex, India’s monsoon and wedding seasons, jewellery demand, the amount of gold being bought/sold by various central banks, changes in mine production and scrap supply, and wild guesses regarding JP Morgan’s exposure to gold. These things are distractions at best. For example, a gold investor/trader could have ignored everything that has been written over the past 20 years about the amount of gold in Comex warehouses and been none the worse for it.

On an intermediate-term (3-12 month) basis, there is a strong tendency for the US$ gold price to trend in the opposite direction to confidence in the US financial system and economy. That’s why most of the seven inputs to my GTFM are measures of confidence. Two examples are credit spreads and the relative strength of the banking sector. The model is useful, in that over the past two decades all intermediate-term upward trends in the gold price occurred while the GTFM was bullish most of the time and all intermediate-term downward trends in the gold price occurred while the GTFM was bearish most of the time.

However, upward corrections can occur in the face of bearish fundamentals and downward corrections can occur in the face of bullish fundamentals. For example, there was a sizable downward correction in the gold market in March of this year in the face of bullish fundamentals. Such corrections often are signalled by sentiment indicators.

Right now, the fundamentals are supportive while sentiment is warning of short-term downside risk.

As long as the fundamentals remains supportive, any short-term decline in the gold price should be ‘corrective’, that is, it should be within the context of a multi-year upward trend.

Print This Post Print This Post
De Facto MMT

May 4, 2020

In a blog post on 31st March I argued that MMT (Modern Monetary Theory) had been surreptitiously put into practice in the US. However, according to a quote from Lacy Hunt (Hoisington Investment Management) included by John Mauldin in a recent letter, what the Fed and the US government are doing doesn’t qualify as MMT.

According to Lacy Hunt: “For the Fed to engage in true MMT, a major regulatory change to the Federal Reserve Acts would be necessary: The Fed’s liabilities would need to be made legal tender. Having the Treasury sell securities directly to the Fed could do this; the Treasury’s deposits would be credited and then the Treasury would write checks against these deposits. In this case, the Fed would, in essence, write checks to pay the obligations of the Treasury. If this change is enacted, rising inflation would ensue and the entire international monetary system would be severely destabilized and the US banking system would be irrelevant.

One problem with Lacy Hunt’s argument is that some of the Fed’s liabilities are already legal tender and have been for a very long time. I’m referring to the $1.9 trillion of “Currency in circulation” (physical notes and coins). This currency sits on the liability side of the Fed’s balance sheet. Also, the money that the US Treasury spends comes from the Treasury General Account, which also sits on the liability side of the Fed’s balance sheet.

Admittedly, the Fed currently does not buy Treasury debt directly. Instead, it acts through Primary Dealers (PDs). The PDs buy the debt from the government and the Fed buys the debt from the PDs. When this happens, new money is credited by the Fed to the commercial bank accounts of PDs and thus becomes a liability of the private banking system. At the same time, the private banks are ‘made whole’ by having new reserves added to their accounts at the Fed.

In other words, rather than money going directly from the Fed to the Treasury General Account (TGA), under the current way of doing things the money gets to the same place indirectly via PDs. This enables the commercial banking system to get its cut, but from both the government’s perspective and the money supply perspective there is no difference between the Fed directly buying government debt and the Fed using intermediaries (PDs) to do the buying.

Now, the Fed’s QE programs of 2008-2014 generated a lot less “price inflation” than many people feared. This was largely because the new money was injected into the financial markets (bonds and stocks) and only gradually trickled into the ‘real economy’. To some extent what happened over the past couple of months is similar, but with two significant differences.

One significant difference between the Fed’s recent actions and the QE of 2008-2014 is that for some of its new money and credit creation the Fed is bypassing the PDs. No regulatory change was needed for this to happen. Instead, as I explained in my earlier post, the Fed created Special Purpose Vehicles (SPVs) that do the actual monetising of assets and the lending of new money into existence. In effect, new money is now being created by the Fed and sent directly to various non-bank entities, including municipalities, private businesses and bondholders.

The second significant difference is the crux of the issue and why the US now has MMT in all but name.

You see, the essence of MMT isn’t the mechanical process via which money gets to the government. The essence is the concept that the government is only limited in its money and debt creation by “inflation”. The idea is that until “inflation” becomes a problem, the government can create as much new money and debt as it wants as part of an effort to achieve full employment. A related idea is that government spending does not have to be financed by taxation.

Is there really any doubt that the US government no longer feels constrained in its creation of debt, the bulk of which is being purchased indirectly using new money created by the Fed? After all, in the space of less than two months the US federal government has blown-out its expected annual deficit from around $1T to around $4T and is talking about massive additional spending/borrowing increases to support the economy. Clearly, no senior politician from either of the main parties is giving any serious thought to how this debt will be repaid or the future implications of the deficit blow-out.

The bottom line is that the US doesn’t have MMT in law, but it does have MMT in fact.

Print This Post Print This Post
The COVID-19 Trade-Off

April 28, 2020

Economics isn’t about money. Money is important because it facilitates the division of labour, but good economic theory applies with or without money. Economics is about how humans allocate scarce resources. This implies that trade-offs are critical to the good economist, because he/she understands that allocating scarce resources to satisfy one need in the present means that these resources will not be available to satisfy another need in the present or the future*. Right now, the entire world is dealing with a trade-off that has far-reaching consequences.

The trade-off is associated with the COVID-19 threat and has been portrayed as being between lives and money, but the correct way to view the trade-off is between lives today and lives in the future. Unfortunately, the people making the decisions regarding what should be done have neither the data nor the knowledge to properly analyse the trade-off.

For one thing, when decisions were made to implement widespread lock-downs these people clearly had no inkling of the short-term cost, in terms of illness and lives, of NOT locking down the economy. We know this because as recently as six weeks ago there were projections of millions of deaths in the US alone**, but the actual rates of death and serious illness have been vastly lower than projected. The experts who made these wildly inaccurate forecasts claim that the vastly lower death rates are due mainly to the lock-downs, but we know this isn’t true based on what happened in countries that didn’t implement draconian social distancing measures. For example, although Sweden, which was not forced into lock-down mode, has experienced a slightly higher rate of infection than its Scandinavian neighbours, its rate of COVID-19 infection is about the same as that of Germany, which is considered to have done a good job of containing the virus via strict social-distancing measures, and much lower than those of Spain, Italy, France and the US.

Even more importantly, the decision-makers are clueless about the long-term costs, in terms of lost lives and lowered living standards, that likely will result from the lock-downs. How could they not be clueless, because in order to make a reasonable assessment you must have a thorough understanding of history and good economic theory. As far as I can tell, not one of the health/medical officials or political leaders at the forefront of the COVID-19 decision-making process has this understanding.

Regarding the cost to human life stemming from locking down large sections of the economy, there is a lot of evidence that people who are poor and out of work are more likely to die than people who are financially comfortable. This is not only because the poorer people have access to lower-quality healthcare and food, but also because they are more prone to stress-related diseases and/or more likely to be subject to physical violence. In addition, a more immediate negative consequence of the lock-downs is that some people have been denied elective surgeries and others have decided not to seek immediate medical treatment for minor issues. This will lead to many deaths over the coming 12 months that would have been avoided with earlier medical intervention.

Note that I refer to GOOD economic theory above, because only a good economist is capable of comprehending the indirect, long-term and unintended consequences of a policy. A bad economist may well believe that shutting down the entire economy for 2+ months is akin to a very long weekend, and that everything will go back to normal soon after the shut-down ends — just like it does every Monday following the 2-day weekend shut-down. Larry Summers is a case in point.

The upshot is that people with power/authority are making decisions regarding a major trade-off between lives today and lives in the future while being in possession of insufficient information about one side and almost no information/knowledge about the other side of the trade-off.

*This is related to Frederic Bastiat’s Broken Window parable, in that what is immediately obvious is the benefit achieved by allocating the resource to satisfy one current need but what isn’t immediately obvious are the benefits that would have accrued if the resources had been allocated differently.

**The experts at Imperial College predicted 2.2M deaths in the US and 510K deaths in the UK.

Print This Post Print This Post
Relax, the Fed is going to make everyone “whole”

April 27, 2020

[This blog post is an excerpt from a recent TSI commentary]

Last week, a highly paid (we assume) JP Morgan analyst opined:

When it comes to market developments, we believe that the Fed’s action last Thursday represents a pivotal moment in this crisis. Powell’s statement included that “we will continue to use these powers forcefully, proactively, and aggressively until we are confident that we are solidly on the road to recovery” and probably the most important, historic statement, “We should make them whole. They did not cause this.” This crisis is different from any other in recent history in that it was not caused in any way by businesses or investors. Unhindered by moral hazard, the response of fiscal and monetary authorities is and will continue to be unprecedented, with the goal of essentially making everyone ‘whole.’ We believe the significance of this development is underestimated by markets, and this reinforces our view of a full asset price recovery, and equity markets reaching all-time highs next year, likely by H1. Investors with focus on negative upcoming earnings and economic developments are effectively ‘fighting the Fed,’ which was historically a losing proposition.

Well, if moral hazard was the only thing that prevented the Fed from acting in the past to eliminate everyone’s losses, then why has the Fed never bothered to eliminate poverty? After all, not every poor person is in that situation due to having done something wrong. In particular, none of the children living in poverty are to blame for their predicament.

Taking a broader view, if it is possible for the central bank to make everyone “whole”, then why are some countries poor? These countries have central banks that are capable of doing what the Fed is now promising to do.

The problem, of course, is that the central bank cannot add real wealth to the economy. It cannot produce anything of real value. All it can do is conjure money and credit out of nothing, thus setting in motion countless exchanges of nothing for something and distorting the price signals upon which markets rely. This is a recipe for more poverty and generally lower living standards in the long term.

At some point during the second half of this year, the release of pent-up demand as restrictions are removed and people go back to work, combined with the flood of new money generated by the Fed, could make it seem as if there has been a ‘V’ bottom in the economy and that the entire recession lasted only about four months. This could enable the SPX to return to within 10% of its February-2020 all-time high before year-end. However, the price distortions that have been and will be caused by the effort to make everyone “whole” will prevent a sustainable recovery.

The deluge of new money will boost asset prices and the prices of life’s necessities, but many businesses that closed their doors during March of 2020 will never re-open and many people who lost their jobs will remain unemployed (and thus dependent upon government handouts). Also, many of the people who do end up with jobs will find that their real incomes have fallen, because there will be an excess supply of labour and the currency’s loss of purchasing power will be reflected to the greatest extent in the prices of things that are in relatively short supply. For the majority of people, therefore, the post-shutdown economy will never be as good as the pre-shutdown economy, not despite the Fed’s efforts but largely because of them.

Print This Post Print This Post
A critical juncture for the gold sector

April 7, 2020

In a blog post three weeks ago, I mentioned that in TSI commentaries over the past year I had been tracking the current performance of the gold mining sector (as represented by the HUI) with its performance during the mid-1980s (as represented by the Barrons Gold Mining Index – BGMI). The 1980s comparison predicted the big moves that have occurred since May of last year, including the Q1-2020 crash. I concluded the earlier post with the comment: “History informs us that after a crash comes a rebound and after a rebound there is usually a test of the crash low.

Here is an update of the weekly chart that I have been showing at TSI for almost a year. The latest price shown for the HUI is last week’s close. The chart suggests that the obligatory post-crash rebound is almost complete and that the next move of consequence will be a decline to test the March low.

If a test of the March low occurs, it should be successful (it’s highly probable that the gold mining indices and ETFs made their bottoms for the year last month). However, with regard to future outcomes there is always more than one realistic possibility. For example, although the historical record suggests that a test of the March low will happen within the next two months, a more bullish short-term outcome is possible.

Parameters that could be used to indicate that a different short-term scenario was playing out have been mentioned at TSI, but at this stage I think the odds favour a test of the crash low for pretty much everything that has crashed, including the gold sector. Looking beyond the short-term, I expect that the major fundamental differences between the late-1980s and the present will assert themselves during the second half of this year and cause the current market for gold mining stocks to diverge (in a bullish way) from the 1980s path.

Print This Post Print This Post
MMT is now a reality

March 31, 2020

[This blog post is an excerpt from a recent commentary published at TSI]

Modern Monetary Theory (MMT), which isn’t modern and isn’t a theory (in the true meaning of the word), is now being put into practice in many countries, including the US. What’s happening isn’t being called MMT, but that’s what it is.

Under cover of the “coronacrisis”, we are now witnessing the introduction of MMT. Specifically, in an effort to alleviate the short-term pain associated with the economy-wide shut-downs that they are enforcing as part of history’s biggest ever over-reaction, governments are now promising to spend money as if they had access to an unlimited supply of the stuff. They can do this because with the help of the central bank they do have access to an unlimited supply of the stuff.

The US government and the Fed are leading the way and in doing so all lines that are supposed to separate these two organisations are being blurred or eliminated. To put it another way, the pretence that the Fed is independent of the government has been dropped.

First, there’s the $2 trillion “stimulus” package that was just signed into effect by President Trump. How could a government that supposedly had to limit the pace of its deficit spending suddenly decide to instantly triple its deficit? Where is the money coming from to do this? After all, nobody is talking about increasing taxes. On the contrary, there is talk of delaying and reducing taxes. Clearly, the plan is for the money to be created out of nothing by the Fed.

Even more tellingly, there are the programs introduced by the Fed over the past two weeks. These are:

a) The Commercial Paper Funding Facility (CPFF), via which the Fed will buy commercial paper from issuers.

b) The Money Market Mutual Fund Liquidity Facility (MMLF), via which the Fed will lend to financial institutions secured by assets purchased by the financial institution from money market mutual funds.

c) The Main Street Business Lending Program (MSBLP), via which the Fed will lend directly to small and medium-size businesses.

d) The Primary Market Corporate Credit Facility (PMCCF), via which the Fed will buy corporate bonds from issuers.

e) The Secondary Market Corporate Credit Facility (SMCCF), via which the Fed will buy corporate bonds and bond ETFs in the secondary market.

f) The Term Asset-Backed Securities Loan Facility (TALF), via which the Fed will support the issuance of asset-backed securities.

Now, the Fed isn’t supposed to do any of the above, but it is getting around the existing regulations by creating Special Purpose Vehicles (SPVs) that will do the actual buying and lending. The US government will fund these SPVs with initial capital that the Fed will leverage 10:1. That is, for every dollar injected by the government into one of these SPVs, the Fed will create 10 new dollars via the traditional methods of fractional reserve banking.

The truly crazy thing is that the dollars that the government will inject into the Fed’s SPVs were previously created out of nothing when the Fed monetised Treasury securities. So, the Fed creates money out of nothing. This money then goes to the government. The government then deposits some of this money into the Fed’s new SPVs, and based on this injection of ‘capital’ the Fed creates a lot more money out of nothing.

The indirect costs, in terms of reduced productivity, higher unemployment and reduced living standards, of this money creation will be huge and long-lasting, but we’ll leave the discussion of these longer-term issues until after the immediate crisis has abated.

Our main point today is that the method of government funding appears to have changed in a permanent way. No longer will governments feel constrained by their abilities to tax the population and borrow from bond investors. From now on they will act like they have unrestricted access to a bottomless pool of money.

Print This Post Print This Post
The inflation expectations crash and what it portends

March 24, 2020

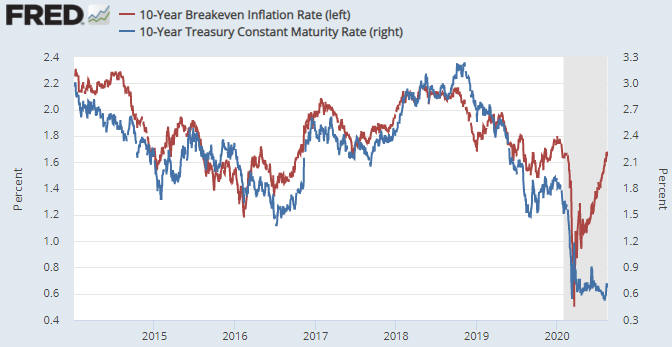
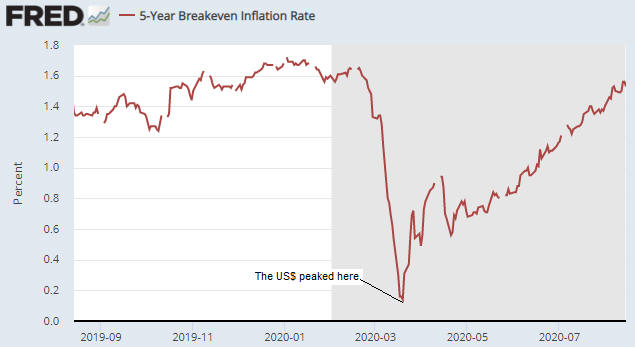
Inflation expectations have crashed along with the stock market and the oil price. This is evidenced by the following chart of the 10-Year Breakeven Inflation Rate, which indicates the average CPI that the market expects the government to report over the years ahead. Since the advent of the TIPS (Treasury Inflation Protected Securities) market in 2003, the Expected CPI was only below last Friday’s level of 0.50% during November-December of 2008 and January of 2009, that is, during the concluding months of the Global Financial Crisis.

10yrExpCPI_240320

The collapse in inflation expectations over the past several weeks does not indicate that “inflation” will be much lower in the future. On the contrary, beyond the short-term it greatly increases the risk of higher “inflation”.

Over the next few months the CPI will be lower than would have been the case in the absence of the coronavirus-related restrictions to economic activity and the plunge in the oil price, but by this time next year the CPI probably will be much higher due to the following:

1) Aggressive central bank reactions to the economic slowdown and the stock market plunge. These reactions will distort prices and hamper the economy, but to a man with nothing except a hammer every problem looks like a nail. To a central banker, every economic problem other than obvious “price inflation” looks like a reason to create more money and credit out of nothing. Also, to the central bankers of the world the recent rapid decline in inflation expectations is like a giant cattle prod pushing them in the direction of pro-inflation monetary policy.

2) In addition to aggressive monetary stimulus there will be aggressive fiscal stimulus. This would be the case anyway under such circumstances, but in the US the short-term stimulus from increased government spending will be more aggressive than usual due to this being an election year.

3) Once the coronavirus threat dissipates, there will be the natural release of pent-up demand.

4) The widespread shutting down of mines, production facilities and trade-related transportation will damage supply chains, in some cases permanently due to parts of ‘chain’ going bust, and ensure that it will take more time than usual for producers to respond to increased demand and rising prices.

Adding the natural force of pent-up demand release to the unnatural forces of monetary/fiscal stimulus and supply disruptions resulting from forced shut-downs should mean that “inflation” will be materially higher a year from now than would have been the case in the absence of the Q1-2020 calamity. My prediction: During the first half of 2021 the official US CPI, which routinely understates the increase in the cost of living, will print above 4%.

Print This Post Print This Post
A strangely successful gold stock model

March 16, 2020

In TSI commentaries since May-June last year I have been tracking the current performance of the gold mining sector with its performance during the mid-1980s. More specifically, I have been comparing the current HUI with the mid-1980s Barrons Gold Mining Index (BGMI). The chart that illustrates this model is displayed below.

The model predicted the rapid rise in the HUI during June-August of last year, the steep correction from a peak by early-September to an October-November low, the rise to a new multi-year high by January-2020 and the crash to a low in March-2020. The big predictions associated with this model are now in the past, which is why I can take the liberty of including it in a free blog post.

The main point I want to make with this post is that even though the present often looks very different from any previous time, the bulk of what happens in the financial markets has happened before. It’s often just a matter of finding the right historical comparison, which is always easier said than done. Also, valid comparisons with previous times always have limited lifespans. It’s possible, for example, that my comparison with the mid-1980s has almost reached the end of its useful life.

Knowledge of how markets have performed in the past, including the distant past (not just the preceding 10-20 years), is useful even if it doesn’t lead to a specific history-based model. For example, anyone with knowledge of market history knows that when the gold mining sector is stretched to the upside near the start of a general stock market crash, it always crashes with the broad market. As far as I know, there have been no exceptions.

History informs us that after a crash comes a rebound and after a rebound there is usually a test of the crash low.

Print This Post Print This Post