Which of these markets is wrong?

May 25, 2016

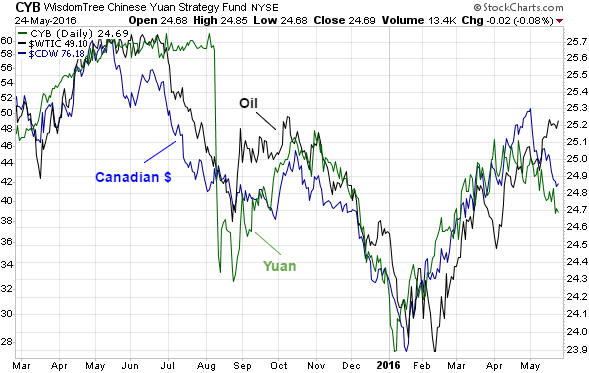
The following chart shows that the US$ oil price, the Canadian Dollar and the Yuan (represented on the chart by the WisdomTree Yuan Fund – CYB) have tracked each other closely over the past 15 months. When divergences have happened, they have always been quickly eliminated.

An interesting divergence has been developing over the past few weeks, with the Yuan having turned downward in mid-April, the C$ having turned downward at the beginning of May and the oil price having continued to rise. Either the currency market is wrong or the oil market is wrong. My money is on the oil market being wrong.

One reason to suspect that the oil market is wrong and that the divergence will therefore be eliminated by a decline in the oil price is recent history. In the second quarter of last year the C$ turned downward about 6 weeks ahead of the oil price and in the first quarter of this year there was an upturn in the Yuan followed by an upturn in the C$ and lastly an upturn in the oil price. That is, the currency market has been leading at turning points.

oil_CYB_C$_240516

Print This Post Print This Post

Nobody Knows Anything

May 24, 2016

Nobody Knows Anything” is a new book written by Bob Moriarty, the proprietor of the 321gold.com web site. It’s close to the book that I would write about investing, but Bob is a better writer than I so it is just as well that he wrote the book before I got around to it.

Achieving good returns by trading/investing in the stock market and other financial markets isn’t complicated. While a certain amount of information gathering and historical knowledge is required, achieving good returns has a lot to do with common sense. However, this doesn’t mean that it is easy. The problem is that we are most comfortable when running with the herd, but herds never have common sense and the investing herd always ends up losing money.

In the chapter on contrarian investing, Bob rightly points out that one of the keys to long-term investing success is not following the herd as it careens from one wealth-destroying blunder to the next.

Many people want to be told what the markets are going to do in the future and especially want to be given specific information about future crashes and spectacular price rises. This creates money-making opportunities for self-styled gurus.

As Bob explains in his book, there are no gurus. Nobody knows exactly when prices will rise, fall, peak and trough, but there is no shortage of people who will happily take your money in exchange for pretending to give you this extremely useful information. What these people are actually giving you are guesses dressed up to look like scientific analyses.

The fact is that in order to consistently buy low and sell high you don’t need to know, or even have an opinion about, when and at what level a market will peak or trough, but advice that helps you manage money prudently will not attract new readers/followers anywhere near as quickly as a big forecast such as “the market will peak on Date X and then plummet by 50%”. As I’ve noted in the past, there is an asymmetric risk/reward to making the big, bold forecast, because failed forecasts are soon forgotten whereas a single correct forecast (guess) about a dramatic market move can be used for promotional purposes forever.

There are many real-life examples in Bob’s book that are directly or indirectly related to the veritable industry that has grown up over the past 18 years around gold and silver manipulation. After explaining that all markets have always been manipulated, Bob delves into some of the silly stories that have been concocted and the terms that have been invented to promote the idea that the gold and silver markets have been subject to a successful multi-decade price-suppression scheme. Because it’s a fact that all financial markets are always manipulated to some extent, it is not difficult to find information that can add a ring of plausibility to a manipulation story that is not only wrong, but would be irrelevant to an investor or trader even if it were right.

Read the book to find out what Bob thinks about the “gold derivatives time bomb”, the possibility of a “commercial signal failure” in the gold market, the risk of a COMEX default, the notion that the “commercials” in the gold futures market are constantly trying to limit up-moves in the price, “naked shorts”, gold-plated tungsten bars, and the story that the 1998 Fed bailout of Long Term Capital Management (LTCM) was at least partly due to LTCM’s short position in gold.

The most important chapter in the book is probably the one titled “When to Sell”, because failing to take money off the table at an appropriate time gets many investors into trouble. Even in cases where an investor does a good job with the buy side of the equation and gets into a position where he has a large profit, dreams of the even greater profits to come will often prompt him not to sell. Instead, he hangs on…and hangs on…until eventually the large profit turns into a loss.

Bob draws on his experiences in the military (he was a fighter pilot during the Vietnam War) and in casinos to illustrate some of the points he wants to make about investing. These personal reminiscences from outside the world of investing are colourful and relevant.

At around 120 pages the book is short, but at the same time it is long on practical information. It is a stream of investing common-sense interspersed with historical examples and personal experiences. I think it would be an enjoyable read even if you aren’t involved in the financial markets, but it should be an especially enjoyable and useful read for anyone who speculates in the shares of junior gold, silver and other natural-resource companies.

Print This Post Print This Post
Money management and the gold mining rally

May 21, 2016

This blog post is a modified excerpt from a TSI commentary published a week ago.

Among other things, good money management involves trading around a core position, with the core position being in synch with the long-term trend. In particular, during a strong intermediate-term rally it involves 1) maintaining core exposure in line with the long-term bull market and 2) methodically scaling back to core exposure as prices move sharply upward.

BOTH of the aforementioned tactics must be used to mitigate the risk of suffering a large loss AND the risk of suffering a large opportunity cost. For example, if you don’t sell anything during a strong rally then you are guaranteed to suffer a large loss once the inevitable ensuing decline occurs and you won’t have either the financial or the emotional capacity to take advantage of future buying opportunities. For another example, if you sell everything when you think that the market is close to a top then it will just be a matter of time before you find yourself on the sidelines with no exposure as prices move much higher than you ever thought possible.

In more general terms, good money management involves embracing the reality that while it is possible to measure — by looking at sentiment and momentum indicators — when a market is stretched to the upside or the downside, it is not possible to RELIABLY predict market tops and bottoms. It is not even possible to reliably identify important market tops and bottoms at the time they are happening. Fortunately, and contrary to what some self-styled gurus will tell you, achieving well-above-average long-term performance does not require the reliable prediction of tops and bottoms.

With regard to my own money management, this year’s rally in the gold-mining sector was the first rally in years that was strong enough to prompt scaling back all the way to ‘core’ (long-term) exposure. This entailed selling almost half of my total position.

I might do a small amount of additional selling if there’s another leg higher within the next few weeks, but I have built up as much cash as I want so my next big move will be on the buy side. However, I will not do any buying into extreme strength. I will, instead, wait as long as it takes for the market to reach a sufficiently depressed level, secure in the knowledge that my core exposure covers me against the possibility of ‘surprising’ additional short-term strength.

Print This Post Print This Post
Charts of interest

May 18, 2016

Here are a few of the charts that currently have my attention.

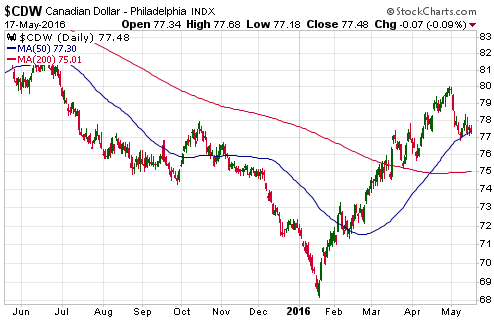
1) The Canadian Dollar (C$). The C$ usually trends with commodity prices, so the owners of commodity-related investments should view the C$’s recent performance as a warning shot.

C$_170516

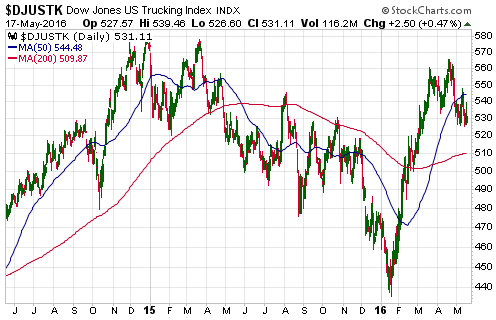
2) The Dow Trucking Index. The huge rebound in this index from its January low is a little strange given the evidence that the trucking industry is in a recession that is a long way from complete.

DJUSTK_170516

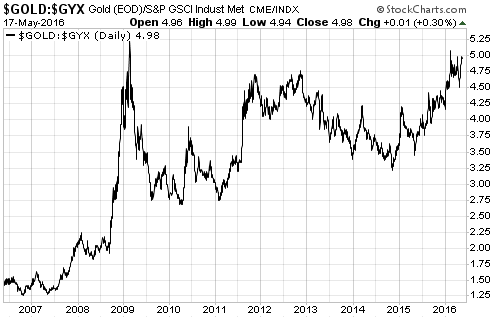
3) The gold/GYX ratio (gold relative to industrial metals). This ratio is a boom-bust indicator and an indicator of financial crisis. In January of this year it got almost as high as its 2009 peak (its all-time high) and remains close to its peak, so its current message is that an economic bust is in progress and/or that a financial crisis is unfolding.

I think that gold will weaken relative to industrial metals such as copper for at least 12 months after the stock market reaches a major bottom, but in the meantime a new all-time high for the gold/GYX ratio is a realistic possibility.

gold_GYX_170516

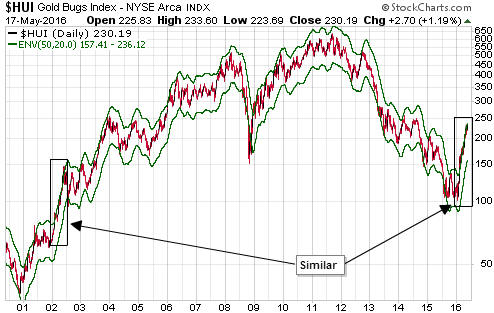
4) The HUI with a 50/20 MA envelope (a 20% envelope around the 50-day moving average). Although I think that the current situation has a lot more in common with the first half of 2001 than the first half of 2002, the way the HUI has clung to the top of its MA envelope over the past few months looks very similar to what it did during the first half of 2002.

HUI_MAenv_170516

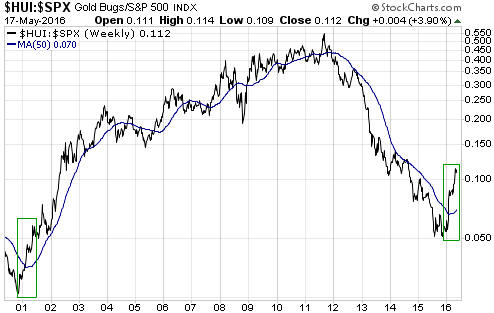
5) The HUI/SPX ratio (the gold-mining sector relative to the broad US stock market). Over the course of this year to date the performance of the HUI/SPX ratio has been similar to its performance from November-2000 through to May-2001.

HUI_SPX_170516

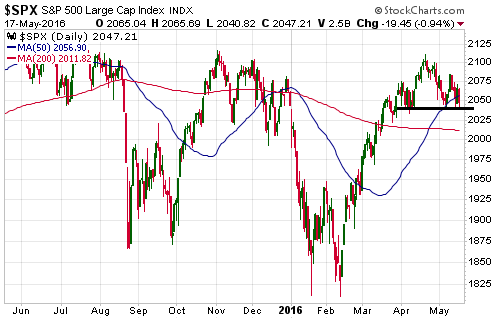
6) The S&P500 Index (SPX). The SPX is standing at the precipice. The probability of a crash within the next two months is almost zero, but a tradable decline looks likely.

SPX_170516

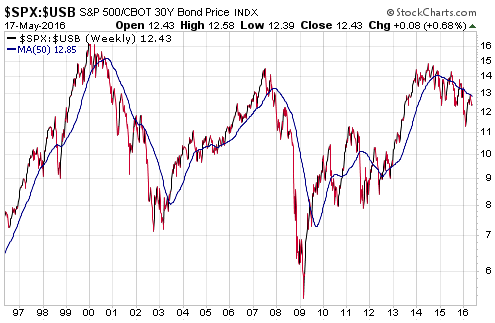
7) The SPX/USB ratio (the broad US stock market relative to the Treasury Bond). Notice the difference between performance following the 2014 peak and performance following the major peaks of 1999-2000 and 2007.

SPX_USB_170516

Print This Post Print This Post