The shift from boom to bust may have begun

March 8, 2022

[This blog post is an excerpt from a commentary published at TSI on 6th March 2022]

The latest leading economic data indicate that the US expansion is intact. This is the case even though the following monthly chart reveals that the ISM Manufacturing New Orders Index (NOI), one of our favourite leading economic indicators, has been working its way downward since hitting a cycle peak about 12 months ago. The reason is that it’s normal for the rate of improvement — which is what the NOI is measuring — to decline while the economy remains in the expansion phase. That being said, we’ve noted over the past two months that the pace of US economic activity is set to slow markedly during the first half of this year.

We wrote a month ago that due to “inflation” remaining near its cycle peak while the pace of economic activity slows, the ‘real’ GDP growth rate during the first quarter of this year could be close to zero. That was before Russia attacked Ukraine and the West imposed severe economic sanctions on Russia, causing additional large increases in commodity prices. As a result of these price increases, the official “inflation” statistics such as the CPI will be higher for longer and calculations of ‘real’ growth will be lower. This could well mean that the headline US GDP growth numbers will be negative in both Q1-2022 and Q2-2022.

Note that a sign of the downward pressure on economic activity resulting from high inflation is the decline in ‘real’ wages. The monthly US Employment Report issued on Friday 4th March contained an estimate that hourly earnings had increased by 5.1% year-over-year in nominal dollar terms. While this is high compared to the average of the past two decades, it’s likely that the cost of living increased by 8%-12% over the same period. This implies that real hourly earnings have fallen by at least a few percent over the past 12 months.

Will the Powell-led Fed make a series of rate hikes in the face of a shrinking economy in response to price rises that are due to supply disruptions? We don’t think so. A Volcker-led Fed would have begun hiking interest rates long ago, but “Mississippi Jay” is the most dovish Fed chairman ever. The Fed almost certainly will make a 0.25% rate hike this month, but we continue to suspect that it will then go on hold for the remainder of the year.

At this stage the leading recession indicators we follow do NOT point to a recession beginning within the next six months (two quarters of negative GDP growth can occur in the absence of a recession), but there’s now a high probability that a boom-to-bust transition will begin during the first half of this year. The recent widening of credit spreads is warning that this is the case, but to confirm a boom-to-bust transition the credit-spread widening will have to be joined by a downward trend reversal in the GYX/gold ratio (the Industrial Metals Index relative to the US$ gold price) and/or a downward trend reversal in the 2-year T-Note yield. The chart displayed below shows that the GYX/gold ratio ended last week at a multi-year high and near the level at which it peaked in 2014 and 2018.

As noted in previous TSI commentaries, the start of a boom-to-bust transition usually precedes the start of an official recession by at least a few quarters.

Print This Post Print This Post

Shift from boom to bust could begin soon

February 15, 2022

[This blog post is an excerpt from a commentary published at TSI about 1.5 weeks ago]

The latest leading economic data indicate that the US expansion is intact. This is the case even though the following monthly chart reveals that in January-2022 the ISM Manufacturing New Orders Index (NOI), one of our favourite leading economic indicators, dropped to its lowest level since June-2020. The reason is that it’s normal for the rate of improvement — which is what the NOI is measuring — to decline while the economy remains in the expansion phase. That being said, there are signs that the pace of economic activity will slow markedly during the first half of this year.

Note that the NOI would have to drop below 55 to stop being a positive influence on the US stock market and below 48 to warn of a recession. We won’t be surprised if it drops below 55 within the next two months, but a decline to below 48 is probably at least 2-3 quarters away.

Regarding the pace of US economic growth, in our previous four “US Recession/Expansion Watch” monthly discussions we wrote that we expected US economic activity to re-accelerate during the final months of 2021 and the early part of 2022 due to inventory building and millions of people returning to the workforce. That happened (for exactly the reasons expected*) and was confirmed by the preliminary estimate of annualised GDP growth coming in at 6.9% for Q4-2021. It was also confirmed by Real Gross Private Domestic Investment (RGPDI), a quarterly statistic that acts as a leading indicator of recession starts and a coincident indicator of recession ends. As illustrated below, RGPDI rose sharply to a new all-time high in the fourth quarter of last year.

Note that the vertical red lines on the following chart mark official recession start dates.

However, the financial markets don’t care what happened months ago; they care what’s going to happen over the months/quarters ahead and there is evidence that the GDP growth rates reported for the first two quarters of this year will be MUCH lower than the rate reported for the final quarter of last year. In fact, due to “inflation” remaining near its cycle peak while the pace of economic activity slows, the “real” GDP growth rate during the first quarter of this year could be close to zero.

The preponderance of evidence from leading economic indicators and confidence indicators points to the H1-2022 economic slowdown occurring within the context of an economic boom, although a pronounced slowdown within a boom and the early part of a boom-to-bust transition can be indistinguishable.

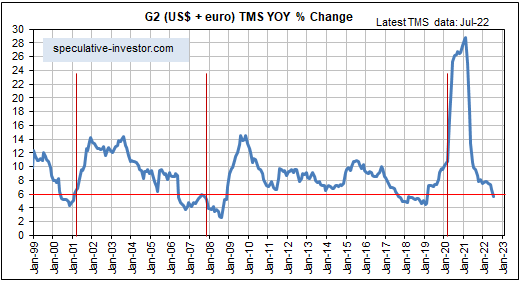
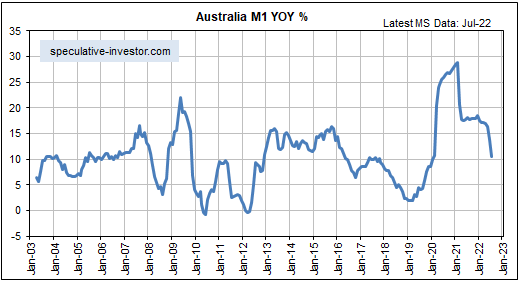
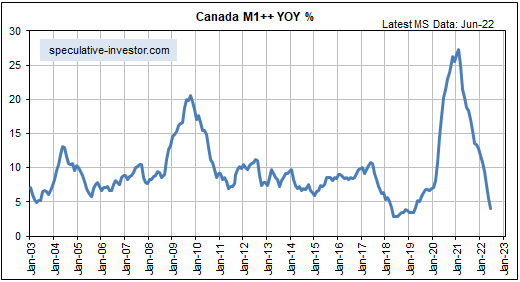
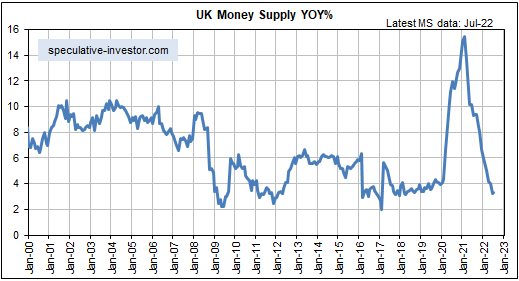
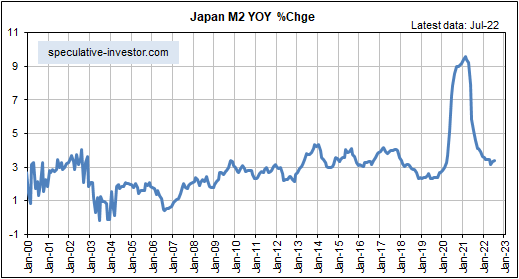
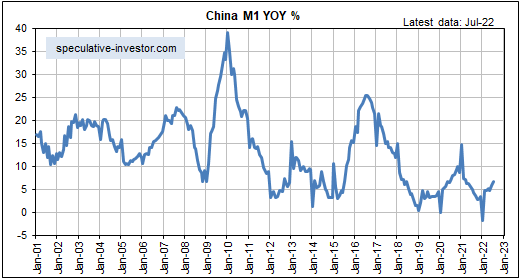
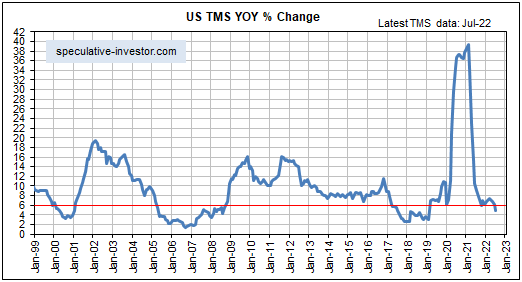
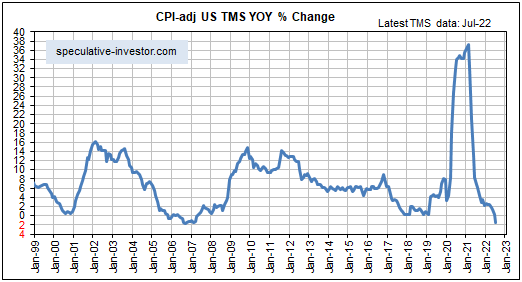
Money-supply trends warn that a boom-to-bust transition could begin as soon as the first half of this year, but the start of a boom-to-bust transition usually precedes the start of an official recession by at least a few quarters and leading economic indicators are a long way from issuing recession warnings. Therefore, the next US recession probably won’t begin any earlier than Q4-2022.

*We noted at the time they were announced that the initial BLS estimates for jobs growth in November and December of last year had massively understated the strength of the US labour market. The latest monthly employment report, which was issued on Friday 4th February, contained revisions to previous months that corrected the errors. The corrections resulted in a combined increase of 709K to the November-December jobs growth total. As a consequence, the employment data now show that the US economy added 1.83M jobs in Q4-2021 and 2.3M jobs over the past four months.

Print This Post Print This Post

It may be ‘one and done’ for the Fed

January 31, 2022

[This blog post is an excerpt from a commentary published at TSI last week]

After the FOMC meeting on Wednesday 26th January, the Fed — via a post-meeting statement and a press conference — made it clear that it plans to end its bond monetisation (QE) program in early-March and hinted strongly that it will make its first rate hike of the cycle in mid-March (the time of the next FOMC meeting). The Fed also discussed its intention to significantly reduce its balance sheet.

What the Fed expects to do and what it ends up doing are often very different. Currently the Fed expects to hike its official interest rate targets in March-2022 as part of a rate-hiking campaign that will entail four rate hikes this year and more rate hikes next year. However, we suspect that the March-2022 hike will turn out to be this year’s only hike, because by May-June it will be clear to the backward-looking Fed that both “inflation” pressure and US economic growth peaked in 2021.

Moreover, we are confident that the Fed will never significantly reduce its balance sheet. It may well start to reduce its balance sheet over the remainder of this year by not replacing maturing debt securities, but it will react to the next serious economic decline the way it has reacted in the past. As a result, its balance sheet probably will be much larger in 18 months’ time than it is today.

The insurmountable problem faced by the Fed is that once an investment bubble of sufficient magnitude to affect a large part of the economy has been inflated, there is no way to let the air out of the bubble without wreaking economic havoc. To postpone the politically unacceptable economic havoc that would result from genuine deflation, every downturn must be met by progressively larger floods of new money. The endgame is hyperinflation and/or a reset involving the establishment of a new monetary system.

We think that the endgame is still many years away. In the meantime, be prepared for more waves of monetary inflation leading to increasingly obvious price inflation, interrupted by the occasional deflation scare.

Print This Post Print This Post

Understanding the yield curve

January 28, 2022

The yield curve is said to be steepening when the gap between long-term interest and short-term interest rates is increasing, but the meaning of the steepening is different depending on whether it is being driven by rising long-term interest rates or falling short-term interest rates. Also, the yield curve is said to be flattening when the gap between long-term interest and short-term interest rates is decreasing, but the meaning of the flattening is different depending on whether it is being driven by falling long-term interest rates or rising short-term interest rates. The two possible yield curve trends (steepening or flattening) and the two main ways that each of these trends can come about results in four different yield curve scenarios as outlined below.

1) A steepening curve driven by rising long-term interest rates (that is, a steepening of the curve along with flat or rising short-term interest rates).

This is indicative of rising inflation expectations. It tends to be bullish for commodities, cyclical sectors of the stock market and relatively high-risk equities and credit. It is bearish for long-dated treasuries.

2) A steepening curve driven by falling short-term interest rates.

This is indicative of declining liquidity and a general shift away from risk. It is bullish for all treasury securities (especially short-dated treasuries) and gold. It is bearish for almost all equities and especially bearish for cyclical and relatively high-risk equities. It is also bearish for commodities and high-yield credit.

3) A flattening curve along with rising short-term interest rates.

This is indicative of an increasing urgency to borrow short to lend/invest long and a general shift towards risk. It tends to be bullish for most equities and high-yield credit. It is bearish for gold and short-dated treasury securities.

4) A flattening curve driven by falling long-term interest rates (that is, a flattening of the curve along with flat or falling short-term interest rates).

This is indicative of declining inflation expectations and increasing aversion to risk. It tends to be bullish for gold, long-dated treasuries and relatively low-risk equities. It tends to be bearish for cyclical stocks and high-yield credit.

In general, scenarios 1 and 3 arise during economic booms, scenario 2 is a characteristic of an economic bust and scenario 4 occurs during a boom-to-bust transition.

The top section of the following chart shows that the 10yr-2yr yield spread, which is one of the most popular measures of the US yield curve, has been declining (indicating a flattening yield curve) since March of 2021. The bottom section of the same chart shows that the yield-curve flattening has occurred in parallel with a rising 2-year yield, meaning that for the past several months we have had yield curve scenario 3. This is evidence that the boom continues. However, a shift to yield curve scenario 4 (indicating a boom to bust transition) could happen soon.

yieldcurve_blog_280122

Print This Post Print This Post