US Recession Watch

December 7, 2022

[This blog post is an excerpt from a commentary published at TSI on 4th December]

At least one of two things should happen to warn that an official US recession is about to begin. One is a decline in the ISM Manufacturing New Orders Index (NOI) to below 48 and the other is a reversal of the yield curve’s trend from flattening/inverting to steepening. For all intents and purposes the first signal triggered in July-2022 when the NOI dropped to 48, whereas the second signal probably won’t trigger until the first half of next year.

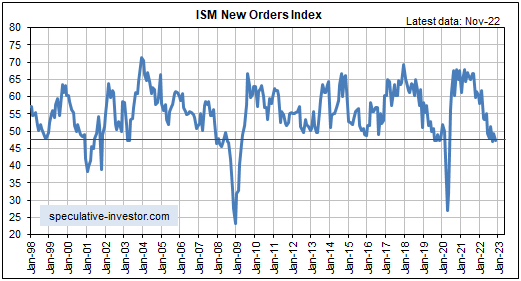
The following monthly chart shows that the NOI dropped to a cycle low of 47.1 in September-2022, ticked up in October and returned to its cycle low in November, leaving the message unchanged. The NOI is signalling that a recession has started or will start soon.

The following chart also shows that the NOI dropped below 40 during the recession period of the early-2000s and dropped below 30 during the 2007-2009 Global Financial Crisis and the 2020 COVID lockdowns. We expect that it will drop below 30 next year.
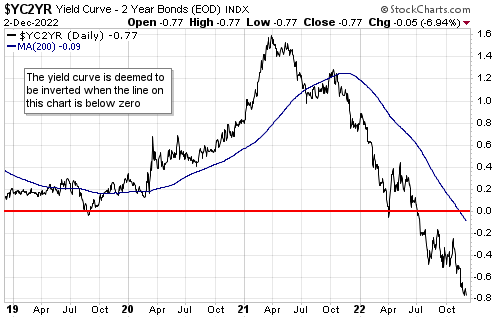
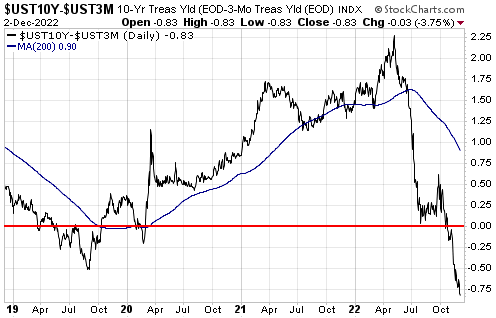
The first of the two daily charts displayed below shows that the 10yr-2yr yield spread, our favourite yield curve indicator, plunged well into negative (inverted) territory during July and remains there. The second chart shows that the 10yr-3mth yield spread, which apparently is the Fed’s favourite yield curve indicator, finally followed suit over the past two months and is now as far into inverted territory as the 10yr-2yr spread.

One of our consistent messages over the past few months has been that a more extreme inversion of the US yield curve would occur before there was a major reversal to steepening. There were two reasons for this. First, the monetary inflation rate (the primary driver of the yield curve) was set to remain in a downward trend until at least early-2023. Second, it was likely that declining inflation expectations would put downward pressure on yields at the long end while the Fed’s rate-hiking campaign supported yields at the short end. For these reasons, we wrote over the past few months that by early 2023 both the 10yr-2yr and 10yr-3mth spreads could be 100 basis points into negative (inverted) territory.

As recently as two months ago our speculation that the 10yr-2yr and 10yr-3mth spreads would become inverted to the tune of 100 basis points (1.00%) by early-2023 looked extreme, especially since the 10yr-3mth spread was still above zero at the time. With both of these spreads now having become inverted by around 80 basis points, that’s no longer the case.

We doubt that the aforementioned yield spreads will move significantly more than 100 basis points into negative territory, because we expect that during the first quarter of next year economic reality (extreme weakness in the economic statistics and the stock market) will hit the Fed like a ton of bricks. This should bring all monetary tightening efforts to an abrupt end, causing interest rates at the short end to start falling faster than interest rates at the long end, that is, causing the yield curve to begin a major steepening trend.
Our conclusion over the past four months has been that the US economy had commenced a recession or would do so in the near future. Due to recent up-ticks in some coincident and lagging economic indicators, we now think that the first quarter of 2023 is the most likely time for the official recession commencement.

Print This Post Print This Post

US monetary inflation and boom-bust update

November 29, 2022

[This blog post is an excerpt from a TSI commentary published last week]

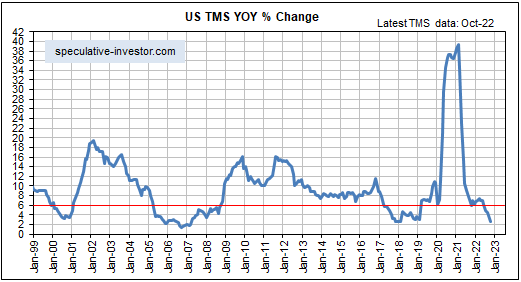
Monetary inflation is the driver of the economic boom-bust cycle, with booms being set in motion by rapid monetary inflation and busts getting underway after the rate of new money creation drops below a critical level and/or it becomes impossible to complete projects due to resource shortages. The following chart shows that the US monetary inflation rate (the year-over-year growth rate of US True Money Supply) extended its decline in October-2022 and is now only 2.6%, down from a peak of almost 40% early last year.

In previous TSI commentaries we wrote that if the Fed were to stick with its balance-sheet reduction plan then by next February the year-over-year rate of US money supply growth probably would be negative, that is, the US would be experiencing monetary deflation. Because nothing disastrous has happened to the overall US economy and the broad stock market YET (at this stage, the disasters have been confined to the economic/market sectors where speculation was the most manic), the Fed almost certainly will stick with its balance-sheet reduction plan for at least a few more months. This means there is a high probability of the US experiencing monetary deflation during the first half of 2023. What would be the likely ramifications?

In a healthy economy a year-over-year decline in the money supply of a few percent would not be a big problem, whereas an economy rife with bubble activities stemming from a massive prior increase in the money supply is not healthy and would be expected to experience a severe downturn in response to monetary deflation or even a period of relative money-supply stability. The current US economy is an example of the latter, making it acutely vulnerable to monetary deflation.

Declining money-supply growth hits the most egregious bubble activities first. For example, many of the most popular stock market speculations of the 2020-2021 bubble period already have lost more than 90% of their market values and the ‘crypto world’ is immersed in a collapse that probably isn’t close to complete. Unfortunately, though, when price signals become distorted by monetary inflation to the point where mal-investment has occurred on a grand scale, it isn’t just the businesses directly involved in the bubble activities that suffer life-threatening contractions after the bubbles burst. Almost everyone gets hurt.

A severe economic downturn during 2023 that possibly extends into 2024 is one ramification of the on-going slide in the monetary inflation rate. Another is that the US economy could experience price deflation, as indicated by the year-over-year rate of CPI growth dropping below zero, during the final quarter of 2023. This combination will, we suspect, lead to a substantial rebound in the Treasury market and a rise in the US$ gold price to new all-time highs within the coming 12 months.

It almost goes without saying that a severe recession and a collapse in the CPI during 2023 will prompt the Fed to initiate another round of money pumping with all of the usual knock-on effects, including new waves of mal-investment and price inflation.

Print This Post Print This Post

Investment Seesaw Update

November 16, 2022

[This blog post is an excerpt from a TSI commentary published last week]

Many times over the years we’ve argued that gold and the world’s most important equity index (the S&P500 Index — SPX) are at opposite ends of a virtual investment seesaw. If one is in a long-term bull market then the other must be in a long-term bear market, with the gold/SPX ratio determining where the real bull market lies. As discussed in a TSI commentary and blog post about five months ago, our ‘investment seesaw’ concept was part of the inspiration for a model, called the Synchronous Equity and Gold Price Model (SEGPM)*, that defines a quantitative relationship between the SPX, the US$ gold price and the US money supply. What is the SEGPM’s current message?

Before we answer the above question, a brief recap is in order.

In general terms and as explained in the above-linked blog post, the SEGPM is based on the concept that there are periods when an increase in the money supply will boost the SPX more than it will boost the gold price and other periods when an increase in the money supply will boost the gold price more than it will boost the SPX, with the general level of trust/confidence in money, the financial system and government determining whether the SPX or gold is the primary beneficiary of monetary inflation. During long periods when trust/confidence is high or trending upward, increases in the money supply will tend to do a lot for the SPX and very little for gold. The opposite is the case during long periods when trust/confidence is low or falling.

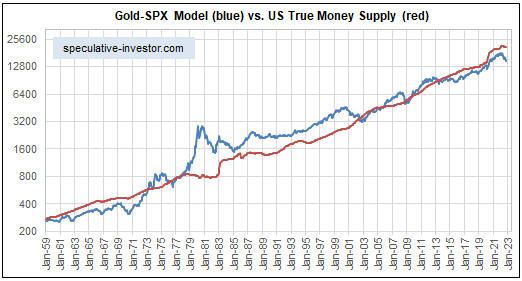
More specifically, the SEGPM is based on the concept that adding the SPX to 1.5-times the US$ gold price (and applying a scaling factor) results in a number that tracks the US money supply over the long-term.

The following monthly chart replicates the model using our calculation of US True Money Supply (TMS). The money supply is shown in red and the SEGPM (the sum of the S&P500 Index and 1.5-times the US$ gold price) is shown in blue.

Currently the SEGPM is as far below the money supply as it has been since 1970-1971, when the gold price was fixed at US$35/ounce. This suggests scope for a catch-up move by the gold-SPX combination over the next two years. Furthermore, if we are right to think that the US and the world are about 6 months into a 1-3 year economic bust, then the catch-up will have to happen via a rise in the US$ gold price.

*The model was created by Dietmar Knoll.

Print This Post Print This Post

US monetary inflation and boom-bust update

November 3, 2022

[This blog post is an excerpt from a commentary published at TSI last week]

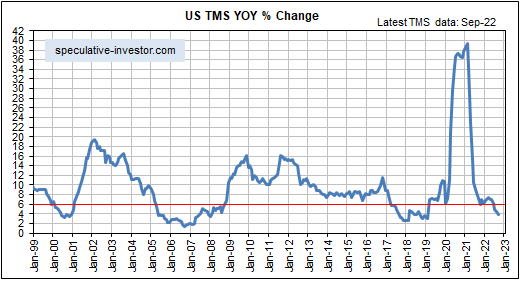
Monetary inflation is the driver of the economic boom-bust cycle, with booms being set in motion by rapid monetary inflation and busts getting underway after the rate of new money creation drops below a critical level and/or it becomes impossible to complete projects due to resource shortages. The following chart shows that the US monetary inflation rate (the year-over-year growth rate of US True Money Supply) extended its decline in September-2022 and is now below 4%, down from a peak of almost 40% early last year.

Due to the economic damage done over multiple cycles by the manipulations of the central bank, the current US economic bust began at a higher rate of monetary inflation than previous busts. In addition, most things related to the current boom-to-bust transition have happened within a compressed timeframe.

In previous cycles over the past three decades, a decline in the monetary inflation rate to below 6% kicked off a sequence lasting 1-2 years encompassing an inversion of the yield curve, a substantial widening of credit spreads (the start of the credit-spreads widening trend combined with the start of an upward trend in the gold/commodity ratio marks the start of the bust phase) and a reversal of the yield curve from flattening/inverting to steepening — PRIOR to the start of an economic recession. This time around, however, all of the above except a steepening of the yield curve occurred within 7 months of a decline in the monetary inflation rate to below 8%.

There is yet to be a reversal in the yield curve from flattening/inverting to steepening, but that’s because this time around the Fed is continuing to tighten monetary conditions aggressively into the teeth of an economic recession. This is similar to what happened in 1973-1974.

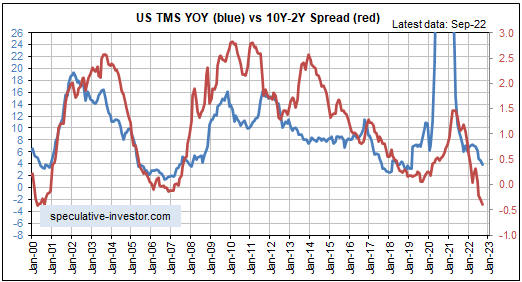
To further explain the above comment, the monetary inflation rate (the blue line on the following monthly chart) drives the yield curve (the red line on the chart). Of particular relevance to this discussion, an inversion of the yield curve (the red line dropping below zero) is an EFFECT of a large decline in the monetary inflation rate, and in general a trend reversal in the yield curve from flattening/inverting to steepening requires an upward trend reversal in the monetary inflation rate.

With the downward trend in the US monetary inflation rate unlikely to end any sooner than the first quarter of next year, a trend reversal in the yield curve (to steepening) is probably still at least several months away. In the meantime, it’s reasonable to expect that the curve will move even further into inverted territory.

As mentioned in the 3rd October Weekly Update, if the Fed sticks with its current balance-sheet reduction plan for only a few more months then by February of next year the year-over-year rate of US money supply growth probably will turn negative, that is, the US will be experiencing monetary deflation. If this happens then the prices of most assets will go much lower than they are today.

As also previously mentioned, economic and stock market weakness eventually will put irresistible pressure on the Fed to commence a new monetary easing campaign, but there is nothing to be gained by trying to guess when that will be. This is because the initial attempts to ‘stimulate’ almost certainly won’t be sufficient to ignite a new boom, and because the stock market usually doesn’t bottom until well after the monetary inflation trend has reversed upward. At the moment we are a long way from such a reversal.

Print This Post Print This Post