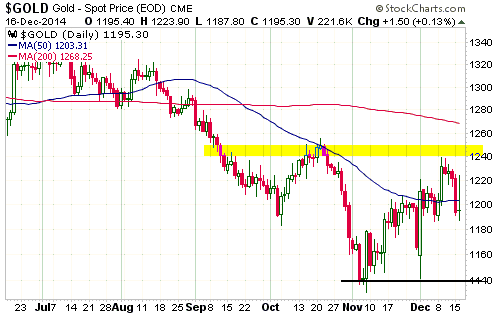
Does the monetary base drive the gold price?

October 10, 2014

Two weeks ago I discussed the claim that the US debt/GDP ratio (the debt of the US federal government divided by US GDP) drove the gold price, with a rising debt/GDP ratio resulting in a higher gold price and a falling debt/GDP ratio resulting in a lower gold price. I explained that the claim was misleading, and that a chart purporting to demonstrate this relationship was both an example of data mining (in this case, cherry-picking a timescale over which the relationship worked while ignoring more relevant timescales over which it didn’t work) and an example of confusing correlation with causation. I also mentioned in passing that there was a similar misleading claim doing the rounds regarding the relationship between gold and the US monetary base (MB). Considering that the failure of the gold price to follow the US MB higher over the past two years is being cited by the usual suspects as evidence of gold-market manipulation, I’ll now briefly address the question: Does the US monetary base drive the gold price?

Those who believe that the answer to the question is “yes” will sometimes show a chart like the one presented below to prove the correctness of their belief. Clearly, if you were armed only with this chart and the conviction that a substantial rise in the US MB should always go hand-in-hand with a rallying gold price, then you would likely take the happenings of the past two years as definitive evidence of artificial gold-price suppression. Of course, you would also have to put aside the fact that the gold price rose 300% from its 2001 low to its early-2008 peak with only a minor increase in the US MB, but this wouldn’t be a problem because it is always easy to come up with a fundamental reason for a large rise in the gold price. It’s only a large price decline that needs to be explained-away by a manipulation theory.

So, is gold’s divergence over the past two years from the on-going rise in the US MB strange or suspicious, such that it can be best explained by market manipulation?

The answer is no. As is the case with the relationship between the gold price and the debt/GDP ratio, the visually-appealing positive correlation of the past several years disappears when the gold-MB relationship is viewed over a much longer timescale. Specifically, the following chart shows that the only period over the past 45 years during which there was a strong positive correlation between the gold price and the monetary base was the three-year period from late-2008 through to late-2011.

I wish that anticipating the performance of the US$ gold price were as easy as monitoring the US monetary base or the Fed’s balance sheet (the monetary base is controlled by the Fed via the expansion/contraction of its balance sheet), but unfortunately the gold market isn’t that simple. The reality is that like a rising debt/GDP ratio, a sharply rising monetary base can be a valid part of a bullish gold story. However, this is only to the extent that it helps to bring about lower real interest rates and/or a steeper yield curve and/or a weaker US dollar and/or rising credit spreads. It isn’t directly bullish.

I think that the first leg of the next substantial multi-year rally in the gold price will be linked to the Fed’s efforts to stabilise or contract the monetary base, because these efforts will expose the mal-investments of the past few years.

Print This Post Print This Post

How can ‘the Commercials’ be so dumb in the currency market and so smart in the gold market?

October 7, 2014

In June of 2012, when there appeared to be a serious threat that Europe’s monetary union would unravel, the Speculative net-short position and the offsetting Commercial net-long position in euro futures reached an all-time high. The following chart from Sharelynx.com shows that over the past two months the Speculative net-short and Commercial net-long positions got almost as high as their 2012 extremes, despite the absence of an existential threat to the euro.

The COT situation tells us that euro-related sentiment is ‘in the toilet’ and that there is a lot of speculative-short-covering fuel to power a euro rally. However, the main reason for including this chart is to show that the Speculative net-short and the Commercial net-long positions had already reached unusually high levels in August when the euro was trading at 1.34. This means that the bulk of the euro’s decline occurred AFTER the Commercials became massively net-long in the futures market. The question is: How could the Commercials be so dumb in the currency market and at the same time be so smart in the gold market?

The answer is that the Commercials are neither dumb in the currency market nor smart in the gold market. As I’ve explained in the past, the Commercial net-position in the futures market is simply a mathematical offset of the Speculative net-position, with Speculators being the driving force behind short-term price trends. The Commercials only appear to have been wrong based on their recent positioning in euro futures and right based on their recent positioning in gold futures because euro speculators (as a group) have recently been right and gold speculators (as a group) have recently been wrong.

It is also worth reiterating that the Commercial position in the futures market does not generally reflect the overall Commercial position. For example, a Commercial that is net-short in the futures market could be either flat or net-long when all positions are taken into account. In fact, a Commercial that establishes a large net-short position in the futures market is probably doing so BECAUSE it has a large net-long position to hedge in the cash market.

When the euro’s short-term trend reverses upward, the Speculators will be on the wrong side of the market and the Commercials will start to look right.

Print This Post Print This Post

The ECB’s monetary machinations

October 3, 2014

The ECB recently launched a two-pronged attack aimed at boosting bank lending to the private sector. These ‘prongs’ are the TLTRO (Targeted Longer Term Refinancing Operation), which got underway on 18th September, and the ABS (Asset Backed Security) and Covered Bond Purchase Program, which will soon get underway. Will these schemes be successful?

That depends on what constitutes success. The schemes cannot possibly foster economic progress, because creating money and credit out of nothing distorts price signals, redistributes wealth from savers to speculators and generally makes the economy less efficient. So, if success is defined as bringing about a stronger economy then failure is guaranteed. However, if success is defined as increasing the size of the ECB’s balance sheet by 1 trillion euros and adding 1 trillion euros to the money supply, then the schemes will probably, but not necessarily, be successful.

The challenge faced by the ECB as it tries to prod the commercial banks into lending more money to the private sector is the dearth of lending opportunities open to the banks. Due to the after-effects of the credit bubble that blew-up in 2008 and the ensuing years during which wealth was siphoned out of the real economy to prevent the holders of government bonds from suffering any losses (part of what we referred to back in 2010 as “the no bondholder left behind policy”), the euro-zone’s pool of willing and qualified private-sector borrowers has experienced severe shrinkage.

The new ABS purchase program is supposed to encourage the commercial banks to be more aggressive in their search for lending opportunities, in that the ECB is effectively saying “if you securitise it, we will buy it”. In other words, the ECB is effectively saying to the banks: “If you make new loans and bundle the loans into a security that can be sold, then you will definitely have a buyer for the security at an attractive price. You will therefore be able to shift the risk from your balance sheet to our balance sheet.” The extent to which the commercial banks will take advantage of this ‘generous’ offer is unknown.

The new ABS purchase program appears to have a better chance than the TLTRO of promoting increased bank lending to the private sector. The reason is that the ABS program enables banks to shift the risk of loan default to someone else (to the ECB and ultimately to tax-payers throughout the euro-zone), whereas the TLTRO is supposed to encourage banks to add risk to their own balance sheets. The TLTRO could still work, though, because the senior managements of banks are often guided by the same type of short-term thinking as most politicians. Just like the average politician is focused on doing/saying whatever it takes to win the next election, the average bank CEO is focused on doing whatever it takes to make the next quarterly and annual earnings reports look good.

Some analysts and commentators are concerned that the ECB’s new money-and-credit creation schemes won’t do enough to bring about the “inflation” that — according to their crackpot theories — the euro-zone needs. Therefore, they believe that the ECB should resort to Fed-style QE (outright large-scale monetisation of government bonds). This prompts me to address the question: Why hasn’t the ECB resorted to Fed-style QE? After all, it is blatantly obvious that Mario Draghi is as ignorant about economics as his Federal Reserve counterpart.

It’s first worth noting that the ECB does not appear to be facing a legal obstacle to the sort of QE programs implemented by the Fed. The ECB is legally prohibited from buying government bonds directly from any euro-zone government, but it is able to buy government bonds in the secondary market. In this respect it is in the same boat as the Fed. Like the ECB, the Fed is legally prohibited from buying US Treasury bonds directly from the US government, but it can buy as many Treasury bonds as it wants from Primary Dealers.

Rather than being legally constrained, the ECB appears to be politically constrained. Whereas some euro-zone governments and national central banks would be in favour of a full-blown QE program, other euro-zone governments and central banks, most notably the German government and the Bundesbank, would be very much against it. That’s why the ECB is coming up with half-measures. At this stage Draghi & Co. can’t get approval for the large-scale monetisation of government bonds, but they can get approval for a monetisation program that will supposedly result in additional credit to private businesses.

Lastly, if the ECB is determined to add 1 trillion euros to its balance sheet and the money supply over the coming 12 months then it will almost certainly find a way of doing so. If the ABS purchase program and the TLTRO don’t do the trick, then some other method will be concocted.

Print This Post Print This Post

Does the debt/GDP ratio drive the gold price?

September 29, 2014

The article linked HERE answers yes to the above question. The correct answer is no.

The above-linked article presents the following graph as evidence that the debt/GDP ratio (US federal government debt divided by US GDP, in this case) does, indeed, drive the US$ gold price. However, this is a classic example of cherry-picking the timescale of the data to demonstrate a relationship that isn’t apparent over other timescales. It is also a classic example of confusing correlation with causation. Many things went up in price during the 2002-2014 period covered by this graph. Should we assume that all of these price rises were caused by the increase in the US government-debt/GDP ratio?

By the way, graphs like this were far more visually appealing — although no more valid — three years ago, because the positive correlation ended in 2011. Since 2011, the debt/GDP ratio has continued its relentless advance while the gold price has trended downward. A similar graph that was popular for a while showed a strong positive correlation between the gold price and the US monetary base from the early-2000s through to 2011-2012, which created the impression that the gold price would continue to rise as long as the US monetary base continued to do the same. Again, though, this impression was the result of confusing correlation and causation.

Here’s a chart showing the relationship between the gold price and the US debt/GDP ratio over a much longer period. This chart’s message is that there is no consistent relationship between these two quantities. For example, the huge gold bull market of the 1970s occurred while the debt/GDP ratio was low with a slight downward bias and actually ended at around the time that the debt/GDP ratio embarked on a major upward trend. In fact, from the early-1970s through to the mid-1990s there appeared to be an INVERSE relationship between the gold price and the debt/GDP ratio, but this is just a coincidence. It doesn’t imply that gold was hurt by a rising debt/GDP ratio and helped by a falling debt/GDP ratio; it implies that the debt/GDP ratio isn’t a primary driver of gold’s price tend. For another example, the gold price and the debt/GDP ratio rose in parallel during 2001-2006, but the rise in the debt/GDP ratio during this period was slow and was not generally considered to be a reason for concern. Therefore, it wasn’t the driver of gold’s upward trend.

The theory that the US government debt/GDP ratio is an important driver of the US$ gold price seems to be solely based on the 3-year period from late-2008 through to late-2011, when the two rocketed upward together.

The reality is that a rising US debt/GDP ratio can be a valid part of a bullish gold story, but only to the extent that it helps to bring about lower real interest rates and/or a steeper yield curve and/or a weaker US dollar and/or rising credit spreads. It isn’t directly bullish for gold, which is why a long-term comparison of the US$ gold price and the US debt/GDP ratio shows no consistent relationship. The same can be said about a rising US monetary base.

Print This Post Print This Post