Financial crises during the Gold Standard era

December 17, 2014

A couple of weeks ago I posted some information about the “Great Depression of 1873-1896″ to make the point that there was no depression, great or otherwise, during this period, but that the period did contain some financial crises/panics. Paul Krugman and others have blamed these financial crises on the Gold Standard, but, as explained in a well-researched article by Brian Domitrovic, the financial crises of the 1800s had similar causes to the financial crises of the 1900s and 2000s: monetary inflation and government meddling. Here are the last few paragraphs in the aforelinked article, dealing with the financial crisis and economic recession of the early-to-mid 1890s:

It is perfectly clear what caused both the huge run-up in output numbers from 1890-92, as well as the tremendous stress on the banking and credit system that led to the drying up of investment and the shuttering of factories in 1893 and beyond. The United States, in 1890, decided to traduce the gold standard.

1890 was the year in which Congress made two of its most intrusive forays into monetary and fiscal policy in the years before the creation of the Fed and the income tax in 1913. It authorized the creation of fiat money to the tune of nearly five million dollars a month, and it passed a 50% increase in tax rates in the principal form of federal taxation, the tariff.

The monetary measure came care of the Sherman Silver Purchase Act, whereby the United States was mandated to buy, with new paper currency, an additional 4.5 million ounces in silver per month. The catch: the currency that bought the silver had to be redeemable to the Treasury in gold too.

Silver-mining interests in Nevada and elsewhere had conned (and surely bribed) Congress into this endeavor. Knowing that their extensive silver was worth little, what better way to cash in on it than get a piece of paper that says the silver can be exchanged for gold, government-guaranteed?

The cascade of new money caused an asset bubble, the tariff made sure the bubble was especially deformed, and the most extended recession of the pre-1913 period hit. The United States, needless to say, ran out of gold to back all the extra currency. J.P. Morgan had to float a gold loan to bail out his pathetic government. With the private banking system devoting its resources to propping up the United States, the market got starved of cash, and the terrible recession came.

In our own era, the Fed prints excess dollars without concern that they be redeemable in gold. Which means that our capital misallocation is extensive and long-term, our recessions are long and deep, our growth trend is shallow, and our complacency about how right we are in contrast to the benighted past is callow and pitiable.”

Print This Post Print This Post
Testing time for gold stocks

December 17, 2014

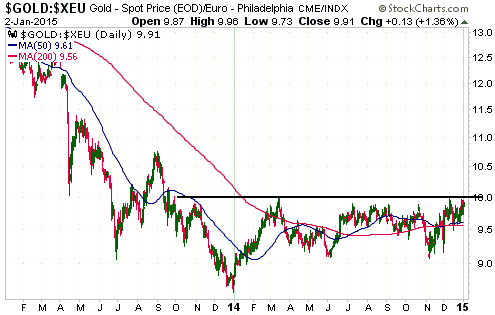
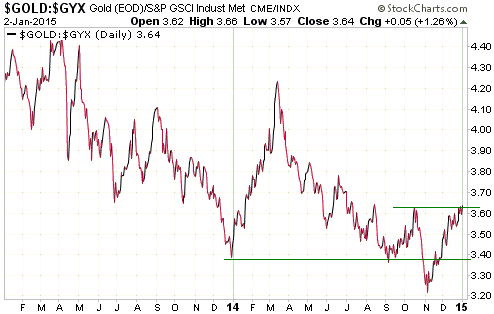
After gold and the gold-mining indices crashed during the final few days of October and the first few days of November, the most likely pattern over the weeks ahead was a rebound and then a successful test of the crash low. Gold bullion successfully tested its crash low on 1st December, but the gold-mining indices didn’t fall far enough at that time to complete a test. The reason is that by the time the North American stock markets opened for trading on 1st December, the gold price had already bounced off its early-November low and was rocketing upward.

The 1st December price action indicated that the gold-mining sector might be able to avoid a test of its crash low, but it wasn’t to be. The HUI and the XAU have just closed lower for five days in a row and are now testing their early-November lows.

I expect the next up-day for the HUI, whether it be today (Wednesday the 17th) or tomorrow or the day after tomorrow, to mark the completion of a successful test of the early-November low and the start of a larger/longer rally than the initial post-crash rebound.

gold_161214

HUI_161214

Print This Post Print This Post
Russia’s stock market is very cheap, but…

December 16, 2014

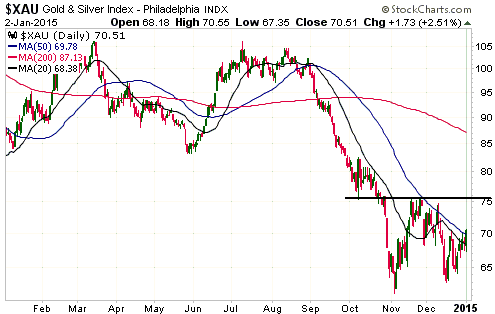
Based on Cyclically Adjusted PE (CAPE), Russia’s stock market is the second cheapest stock market in the world. Its current CAPE is around 5, compared to 27.9 for the US. By this measure only the Greek stock market is cheaper, but the Greek stock market has no dividend yield to speak of. Taking into account both CAPE and dividend yield, the Russian market is clearly the world’s cheapest (refer to http://www.starcapital.de/research/stockmarketvaluation for valuation data on many stock markets around the world). This means that it will probably generate outsized returns over the next few years. However, the following chart suggests that it won’t start providing relatively good returns until commodity prices begin trending upwards, regardless of how cheap it gets.

The chart shows that the RSX/EEM ratio (Russian equities relative to Emerging Market equities) trends with the Continuous Commodity Index (CCI). Russia is in the news a lot these days, due to geopolitical issues, economic sanctions and other economic problems, and, at the time of writing this post, a desperate effort to stop the devaluation of the Ruble by hiking the official interest rate from 10.5% to 17%, but it’s the trend in commodity prices that really matters.

RSX_EEM_CCI_161214

Print This Post Print This Post
How cheap are gold stocks, really?

December 15, 2014

This post is a modified excerpt from a commentary posted at TSI a few weeks ago.

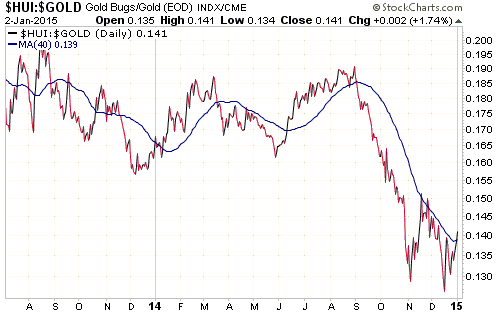
At its recent low the HUI was trading at the same price at which it traded way back in 2003-2004, when the gold price was $350-$400/oz. On the surface, this suggests that at their recent lows the senior gold-mining stocks that dominate the HUI were absurdly under-valued relative to gold, given that gold was trading at around $1150/oz at the time. Just how extreme was the under-valuation?

According to the article posted HERE, the HUI’s under-valuation was so extreme it was completely irrational. For example, the article contains the following statements:

While gold stocks indeed should’ve been sold with gold weaker, the magnitude of selling they suffered was far beyond anything justifiable fundamentally. This ultimately culminated in the latest gold-stock capitulation where the HUI plunged to 11.3-year lows! Think about that a second. Gold stocks were just trading at prices not seen since July 2003. Pretty much the entire secular gold-stock bull had been fully erased.

And: “… [the] entire not-widely-followed gold-stock bull was based on the massive fundamental boost to gold-mining profits that gold’s own secular bull created. So if the recent gold-stock price levels were righteous, gold too should have been pounded back down towards its mid-2003 levels. Where was gold trading back then? Merely right around $350!

And: “Do gold stocks deserve to trade today as if gold was at just $350? Heck no! Last week when gold stocks’ latest capitulation low was carved, the gold price was up near $1150. That was 3.3x higher than the last time the gold stocks traded at recent levels! It makes no fundamental sense whatsoever for gold stocks to trade as if gold was at $350 when it was actually $1150. Their core fundamentals are now vastly better.

The analysis encapsulated in the above excerpts is superficial and misleading, for two main reasons. First, production costs are vastly higher now than they were in 2003-2004. Second, although the stock prices of the senior gold miners are, on average, not much higher now than they were when gold was trading at $350-$400/oz, their market capitalisations are hundreds of percent higher thanks to massive inflation of share quantities. Consequently, a good argument can be made that the “core fundamentals” are now worse than they were when the gold price was $350-$400.

I’ll now consider the specific case of Goldcorp (GG) to back-up my point. During the quarter ended 30th September 2003, GG managed to achieve a net profit of $0.13/share, a net operating margin of 44% and a return on invested capital (ROIC) of 22%. These results were achieved at an average realised sale price of $364/oz. During the quarter ended 30th September 2014 GG’s average realised sale price was $1266/oz, but the company reported a net LOSS of $0.05/share and was too embarrassed to highlight the ROIC. Note that there were no large asset writedowns in the latest quarter. GG was simply not profitable at $1266/oz in Q3-2014 after being very profitable at $364/oz way back in Q3-2003. And by the way, from Q3-2003 to Q3-2014 GG’s share count rose from 183M to 814M, so although its share price is up by ‘only’ about 50%, its market cap is up by about 580% over the period in question.

I selected GG for my quick-and-dirty case study because it has been one of the best-managed of the senior gold producers and has had less company-specific problems than some of its brethren. Had I chosen either Barrick Gold (ABX) or Kinross Gold (KGC) my point could have been made even more clearly, because the amount of wealth destroyed by these companies via ill-conceived acquisitions and project developments is mindboggling.

It’s important that fundamentals-oriented speculators who buy gold-mining stocks have their eyes wide open and understand the reality of the current situation. There are some good reasons to anticipate large gains in gold-stock prices over the coming 2 years involving a rising gold price, declining production costs and improving sentiment, but at the current gold price and with their current cost structures most gold producers are NOT particularly cheap by traditional valuation standards.

Therefore, don’t be hoodwinked by superficial comparisons into believing that gold stocks are now priced for a hundreds-of-dollars-per-ounce lower gold price and, as a consequence, that massive gains lie ahead for gold stocks even if the gold price flat-lines or continues to trend downward.

Print This Post Print This Post