[This blog post is an excerpt from a recent commentary at specuative-investor.com]
We consider gold bullion and the S&P500 Index (SPX) to be effectively at opposite ends of an investment seesaw, with the SPX doing better when confidence in money, central banking and government is rising and gold doing better when confidence in money, central banking and government is falling. As discussed in a few TSI commentaries and blog posts over the past two years (for example, HERE), our investment seesaw concept was part of the inspiration for the Synchronous Equity and Gold Price Model (SEGPM) created by Dietmar Knoll.
In general terms, the SEGPM uses historical data to define a quantitative relationship between the SPX, the US$ gold price and the US money supply. More specifically, it is based on the fact that adding the SPX to 1.5-times the US$ gold price (and applying a scaling factor) has, over the long-term, resulted in a number that tracks the US money supply. Consequently, it indicates the extent to which the combination of the US stock market and gold is currently under/over-valued compared to the money supply and can provide clues regarding likely future price levels for gold and the SPX. For example, a forecast of likely future levels for the SPX and the money supply would project a likely future level for the US$ gold price.
The following monthly chart shows our version of the SEGPM. On this chart, the red line is US True Money Supply (TMS) and the blue line is the Gold-SPX Model (the sum of the S&P500 Index and 1.5-times the US$ gold price, multiplied by a scaling factor).
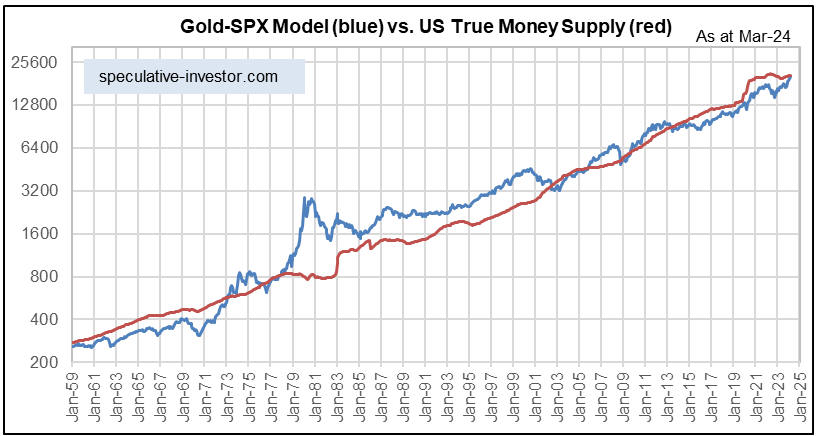
The Model’s current message is that at today’s levels of the money supply and the SPX, the gold price (around US$2150) is in the right ballpark. A much higher ‘fair value’ for gold would require a larger money supply and/or a lower SPX. For example, if the money supply were 5% larger and the SPX were around 4200 (about 20% lower than it is today), the Model would indicate a ‘fair value’ for gold of around US$3200/oz.
In the middle of last year (the last time we discussed the Gold-SPX Model) we thought that the low-$3000s for the US$ gold price was a plausible target for the first half of this year. While it is not out of the question that this target will be reached during the first half of this year, this is no longer a likely scenario because the SPX has performed much better than we thought it would. However, there is a good chance that the low-$3000s will be reached before the end of this year.