October 30, 2015
A recent Bloomberg article notes that household leverage in Australia is now almost twice the developed-market average. Specifically, the article states that Australia’s household debt as a proportion of gross domestic product has risen to a record 134 percent, the highest among 36 developed- and emerging-market nations analysed by Barclays. This compares to a developed-market average of about 74 percent.
The article contains the following chart, which suggests that the easy-money policy of the country’s central bank is driving the housing-finance binge.
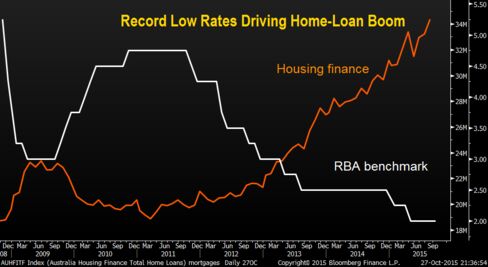
This is not going to end well.