This blog post is a modified excerpt from a recent TSI newsletter.
One of the bullish arguments on the US economy and stock market involves pointing out that a) the yield curve hasn’t yet signaled a recession, and b) the historical record indicates that recessions don’t happen until after the yield curve gives a warning signal. This line of argument arrives at the right conclusion for the wrong reasons.
The bullish argument being made is that every recession of the past umpteen decades has been preceded by an inverted yield curve (indicated by the 10-year T-Note yield dropping below the 2-year T-Note yield). The following chart shows that while the yield curve has ‘flattened’ (the 10yr-2yr spread has decreased) to a significant degree it is still a long way from becoming inverted (the yield spread is still well above zero), which supposedly implies that the US economy is not yet close to entering a recession.
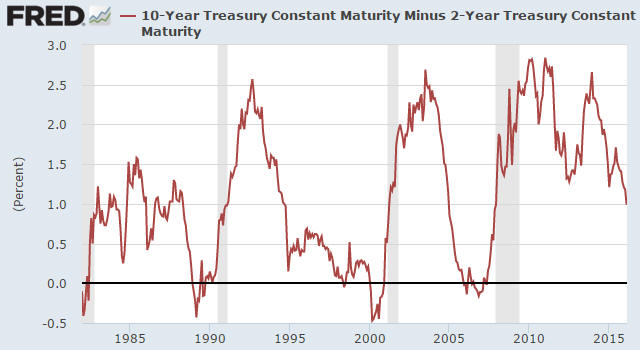
The problem with the argument outlined above is that it doesn’t take into account the unprecedented monetary backdrop. In particular, it doesn’t take into account that as long as the Fed keeps a giant foot on short-term interest rates it will be virtually impossible for the yield curve to invert. It should be obvious — although to many pundits it apparently isn’t — that the Fed can’t hold off a recession indefinitely by distorting the economy’s most important price signal (the price of credit), that is, by taking actions that undermine the economy.
The logic underpinning the bullish argument is therefore wrong, but it’s still correct to say that the yield curve hasn’t yet signaled a recession. The reason is that an inversion of the yield curve has NEVER been a recession signal; the genuine recession signal has always been the reversal in the curve from ‘flattening’ (long-term interest rates falling relative to short-term interest rates) to ‘steepening’ (long-term interest rates rising relative to short-term interest rates) after an extreme is reached. It just so happens that under more normal monetary conditions, an extreme isn’t reached and the reversal therefore doesn’t occur until after the yield curve becomes inverted.
This time around the reversal will almost certainly happen well before the yield curve becomes inverted, but it hasn’t happened yet.