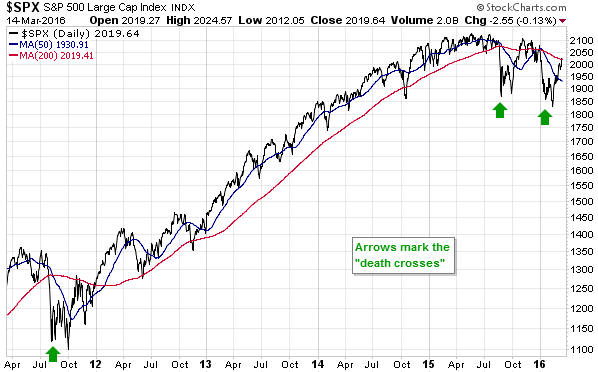
A “death cross” is when the 50-day moving average (MA) goes from above to below the 200-day MA. According to conventional wisdom death crosses are bearish, but they often occur near short-term price lows and therefore tend to be bullish.
For example, over the past 5 years the S&P500 Index (SPX) has experienced three death crosses. The first occurred near the August-2011 price bottom, which turned out to be a wonderful time to buy. The second occurred near the August-2015 price bottom, which was last year’s low. The third occurred near the low in January this year. I’ll be surprised if the January low turns out to be the 2016 low, but it was followed by a tradable rally.
A “golden cross” is when the 50-day moving average (MA) goes from below to above the 200-day MA. According to conventional wisdom golden crosses are bullish, but they often occur near short-term price highs and therefore have short-term bearish implications more than half the time.
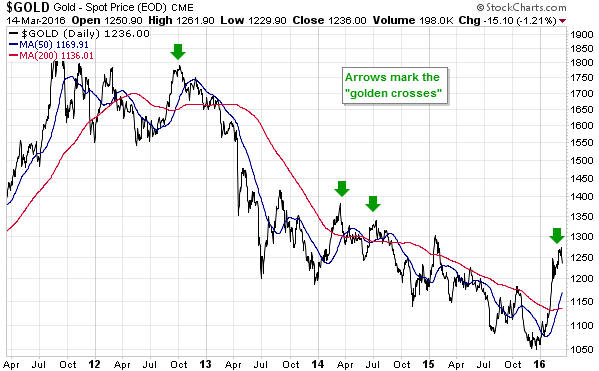
For example, short-term tops in the gold price occurred near “golden crosses” in September-2012, March-2014 and July-2014. Also, it’s too soon to know for sure, but it seems that a golden cross marked a short-term top in the gold price during the first half of this month.
Death crosses tend to have short-term bullish implications because they often happen around the time that the market becomes stretched to the downside. Similarly, golden crosses regularly have short-term bearish implications because they often happen around the time that the market becomes stretched to the upside.