Here are a few of the charts that currently have my attention.
1) The Canadian Dollar (C$). The C$ usually trends with commodity prices, so the owners of commodity-related investments should view the C$’s recent performance as a warning shot.
2) The Dow Trucking Index. The huge rebound in this index from its January low is a little strange given the evidence that the trucking industry is in a recession that is a long way from complete.
3) The gold/GYX ratio (gold relative to industrial metals). This ratio is a boom-bust indicator and an indicator of financial crisis. In January of this year it got almost as high as its 2009 peak (its all-time high) and remains close to its peak, so its current message is that an economic bust is in progress and/or that a financial crisis is unfolding.
I think that gold will weaken relative to industrial metals such as copper for at least 12 months after the stock market reaches a major bottom, but in the meantime a new all-time high for the gold/GYX ratio is a realistic possibility.
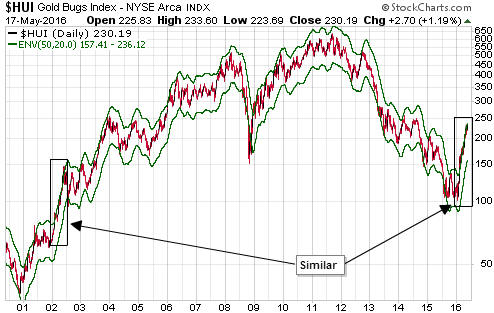
4) The HUI with a 50/20 MA envelope (a 20% envelope around the 50-day moving average). Although I think that the current situation has a lot more in common with the first half of 2001 than the first half of 2002, the way the HUI has clung to the top of its MA envelope over the past few months looks very similar to what it did during the first half of 2002.
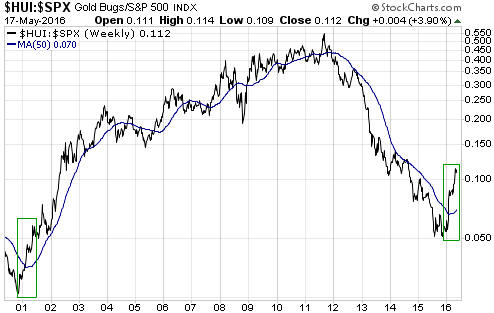
5) The HUI/SPX ratio (the gold-mining sector relative to the broad US stock market). Over the course of this year to date the performance of the HUI/SPX ratio has been similar to its performance from November-2000 through to May-2001.
6) The S&P500 Index (SPX). The SPX is standing at the precipice. The probability of a crash within the next two months is almost zero, but a tradable decline looks likely.
7) The SPX/USB ratio (the broad US stock market relative to the Treasury Bond). Notice the difference between performance following the 2014 peak and performance following the major peaks of 1999-2000 and 2007.