[This blog post is an excerpt from a recent commentary at speculative-investor.com]
Over the past few hundred years there has been a relationship between the extent of global military conflict and secular trends in commodity prices, with secular upward trends in commodity prices coinciding with increases in both the frequency and amplitude of military conflict. We’ve covered this topic in the past, but not recently (the most recent discussion was in 2017). Due to what has happened over the past two years, this is a good time for a revisit.
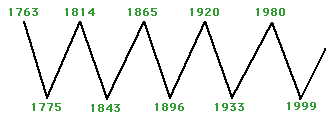
In his book “War Cycles Peace Cycles”, Richard Kelly Hoskins discussed the aforementioned relationship and presented a chart similar to the one displayed below. The chart depicts the secular trends in commodity prices over the past 260 years. Hoskins explained that most of the important military conflicts occurred during the up phases on the chart, and therefore referred to the secular commodity-price uptrends as “war cycles”. The secular commodity-price downtrends were termed “peace cycles”.

A plausible explanation for why long-term advances in commodity prices are accompanied by a general increase in military conflict is that war leads to more monetary inflation, government spending and government intervention in the economy, as well as large-scale resource wastage and supply disruptions — the perfect recipe for higher commodity prices. In addition, when structures get destroyed by war, the commodities that are embedded in these structures are destroyed and eventually get replaced as part of a rebuilding process, causing a large temporary increase in commodity demand. There is also a feedback mechanism whereby military conflict and the associated monetary inflation bring about higher commodity prices, while higher commodity prices add to international tensions and increase the probability of military conflict.
A new “war cycle” began with the secular low for commodity prices in 1999 and has been marked, to date, by the 9/11 terrorist attacks, the Afghanistan and Iraq Wars, the nebulous “War on Terror”, the “Arab Spring” uprisings, the overthrow of Libya’s government, the rise of the Islamic State organisation, an initial increase in tensions between “the West” and Russia in 2008 related to the expansion of NATO (in particular, talk of adding Ukraine and Georgia to NATO) and culminating in the annexation of Crimea by Russia in 2014, a long and devastating war in Yemen involving Yemeni factions and Saudi Arabia, a war in Syria, China’s provocative expansion in the South China Sea, a further increase in tensions between the West and Russia leading to Russia’s invasion of Ukraine in 2022, the Israel-Hamas war that began in October-2023 and the recent Houthi attacks on ships in the Red Sea.
At this stage the current war cycle has lasted about 25 years, while the average length of a war cycle during the period covered by the above chart is 33 years. Therefore, the historical record indicates that if the current cycle is close to the average length then we can ‘look forward’ to another 8 years or so of rising commodity prices and increasing geopolitical conflict.
 Print This Post
