[This blog post is an excerpt for a commentary published at speculative-investor.com on 19th November 2023]
There was a government-spending-fuelled burst of economic activity in the US during the third quarter of this year that led to a high GDP growth number being reported for the quarter, but signs of weakness are now appearing in coincident economic indicators.
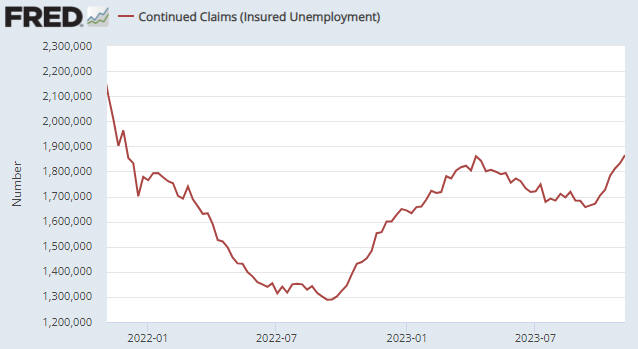
The most important of the aforementioned signs is the rise in Continuous Claims for Unemployment Insurance. With reference to the following weekly chart, Continuous Claims bottomed in September-2022, moved higher into April of this year, dropped back to a higher low during September and has just confirmed an upward trend by moving above its April-2023 high. This is consistent with our view that a US recession will begin before the end of this year, although based on the historical record the recession start date won’t become official until the second half of next year.

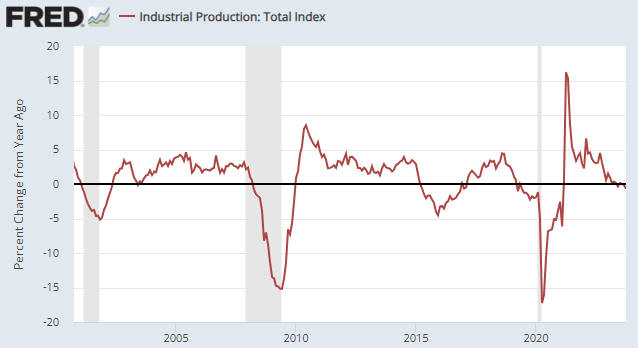
Another sign is the decline in the year-over-year (YOY) growth rate of Industrial Production (IP) to negative 0.70%, the lowest level since February-2021. The YOY growth rate of IP in October-2023 is similar to where it was in the month before the start of the 2001 recession and is well below where it was at the start of the 2007-2009 recession. Below is a chart of this coincident economic indicator.

It probably will be many months before the US coincident economic data become consistently weak. In the meantime, we expect to see — and should see, if our current outlook is correct — a gradual increase in the proportion of economic statistics that are worse than generally expected. We also expect to see a gradual shift away from the “soft landing” narrative (the belief that the US economy will make it through the monetary tightening without a recession) towards the recession narrative.
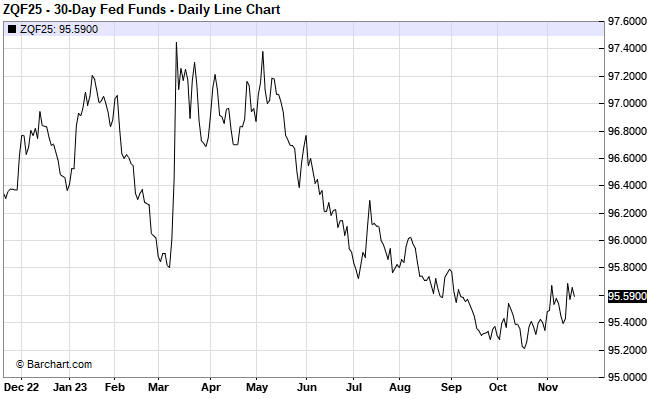
A few weeks ago (refer to the 30th October Weekly Update) we noted early signs that the financial world was starting to move away from the soft landing scenario. One of the indicators that we are tracking to check that this shift remains in progress is the January-2025 Fed Funds Futures (FFF) contract, a daily chart of which is displayed below. Note that the line on this chart moves in the opposite direction to interest rate expectations.
The substantial downward move on this chart from early-May through to mid-October reflects a major increase in the popularity of the soft landing scenario, while the relatively small upward move over the past few weeks is tentative evidence that a shift towards general belief in a less innocuous economic outcome has begun.
At this time, the soft landing narrative remains dominant. That’s why the SPX has rebounded to within 2% of its high for the year and the January-2025 FFF contract has retraced only a small part of its May-October decline. However, we expect that belief in a soft landing will dissipate over the next six months, leading to a substantial decline in the stock market and a substantial rise in the US$ gold price.

 Print This Post
