[This blog post is an excerpt from a commentary published at TSI last week]
One of the few commonly-believed things about gold that is actually true is that gold tends to become more valuable when the real interest rate is trending downward and less valuable when the real interest rate is trending upward. Furthermore, although the real interest rate trend is just one of seven inputs to our Gold True Fundamentals Model (GTFM) and usually doesn’t have a greater effect than the other inputs, over the past three months it clearly has been the dominant fundamental influence on the US$ gold price. This prompted us to ask: Have there been times in the past when the change in the real interest rate trumped all other considerations?
Before we answer the above question we’ll reiterate a point we’ve made numerous times in the past, which is that the only way to get an accurate read on the real US interest rate trend is via the yields on Treasury Inflation Protected Securities (TIPS). Unfortunately, the TIPS market did not exist prior to 2003, so there is no way of measuring the performance of real interest rates during earlier periods. In particular, it would be extremely useful to know the performance of real interest rates during the 1970s (the last time that “inflation” was widely viewed as “Public Enemy No. 1”), but the information simply isn’t available. It is tempting to calculate the real interest rate that prevailed in earlier periods by using what is available, for example, by subtracting the year-over-year change in the CPI from the nominal interest rate. However, you can’t make up for the lack of a legitimate number by using a bogus one.
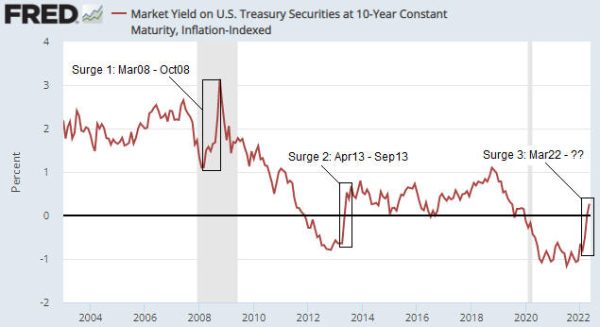
As far as we can tell, during the 19.5 years since the TIPS market came into being there has been only one other multi-month period when the real interest-rate trend caused a sizable move in the gold price that was counter to the overall fundamental backdrop. That period was March-October of 2008, which is the first of the three real interest rate (10-year TIPS yield) surges labelled on the following chart. During March-October of 2008 the overall fundamental backdrop was supportive for gold, but the real interest rate rise was large enough and fast enough to trump the bullish influences on the US$ gold price.
By the way, the second of the three real interest rate surges labelled on the chart occurred during April-September of 2013. This one doesn’t qualify because it occurred when economic growth expectations were rising and the overall fundamental backdrop was bearish for gold.

Like the real interest rate surge during March-October of 2008, the one that began on 8th March of this year has occurred in parallel with collapsing economic growth expectations. The difference is that whereas the 2008 surge in the TIPS yield was driven by plunging inflation expectations, the 2022 surge has been driven by rising nominal interest rates.
Despite the overall gold-bullish fundamentals, in 2008 the US$ gold price remained in a downward trend until the TIPS yield peaked. Gold then quickly retraced its decline and gold mining stocks sprang back like beachballs that had been held underwater. Based on the way things are going it is likely that something similar will happen this year.
 Print This Post
