[This blog post is an excerpt from a recent TSI commentary]
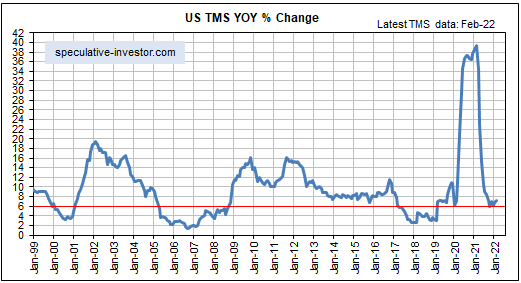
The phenomenal rise in the US monetary inflation rate from early-2020 to early-2021 fuelled a speculative mania in the stock market and set in motion an economic boom, while the subsequent plunge in the monetary inflation rate will lead to an equity bear market and an economic bust. A lot of speculation has been wrung-out of the stock market in parallel with the plunge in the pace of new money creation, but there remains some doubt as to whether or not the economic boom is over.
Just to recap, a boom is a surge in economic activity, involving both consumption and investing, in response to price signals caused by monetary inflation. It fosters the impression that great economic progress is being made, but most of the apparent gains achieved during the boom will prove to be ephemeral because the underlying price signals are false/misleading. It will turn out that there are insufficient resources (labour and materials) to complete projects and/or that resources cost a lot more than planned and/or that the consumption forecasts upon which business additions/expansions were based were far too optimistic. The realisation, stemming from rising costs and lower-than-forecast cash flows, that many of the investments made during the boom years were ill-conceived sets in motion the bust phase of the cycle. During the bust phase, boom-time investments get liquidated.
The economic bust will be ‘explained’ by Keynesians* as a collapse in aggregate demand stemming from a mysterious collapse in confidence (“animal spirits”) and will prompt policies aimed at creating a new boom (a new batch of false price signals upon which future investing mistakes will be based), thus perpetuating the cycle.
As mentioned above, there remains some doubt as to whether or not the latest US economic boom is over. Some indicators say it is, while others are yet to confirm. Also, although the monetary inflation rate has crashed from its February-2021 high, the following monthly chart shows that it is still slightly above the boom-bust threshold of 6%**.
We defined the threshold based on the historical record, in that over the past few decades a boom-to-bust transition for the US economy didn’t begin until after the monetary inflation rate dropped below 6%. However, due to the structural damage to the economy resulting from the Fed’s manipulations of money and interest rates over many decades and especially over the past decade, it’s possible that a bust will begin with the monetary inflation rate at a higher level than in the past.
In any case, the monetary inflation rate should never be used for timing purposes. There are other measures, such as credit spreads, that signal when the monetary inflation rate has risen far enough to set in motion a boom or fallen far enough to set in motion a bust. These measures suggest that the US economy is now in the early part of a bust, although the evidence is not yet conclusive.

*All senior central bankers and most politicians are Keynesians.
**Due to tough year-over-year comparisons, we thought that the US monetary inflation rate (the year-over-year rate of growth of the True Money Supply) would drop below 6% during the first two months of this year. The reason it didn’t is that more than $800B was added to the money supply over the course of those months. The 2-month money-supply surge to begin 2022 was due to a reduction in the Fed’s reverse repo program (this put about $300B back into circulation), an increase in commercial bank credit (this created about $240B of new money), Fed monetisation of securities (this created about $150B of new money) and, we suspect, the flight of some money to the US to escape the troubles in Europe.
 Print This Post
