[This blog post is an excerpt from a recent commentary published at TSI]
Gold is inherently a stronger currency than the US$. This is because the total supply of gold increases by about 1.5% every year, whereas the total supply of US dollars seldom grows at a rate of less than 4% per year and periodically experiences double-digit annual percentage growth. As a result, the US stock market should peak in gold terms well before it peaks in US$ terms, which is exactly what has happened in the past.
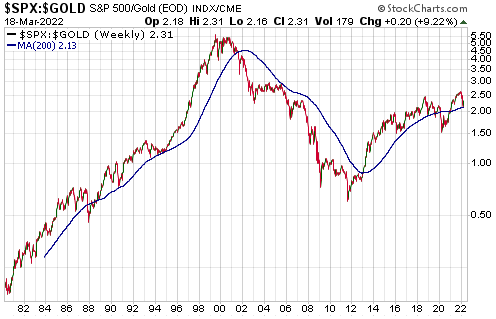
The following weekly chart shows the S&P500 Index in gold terms since 1980. With regard to the past 25 years, the two peaks that stand out on this chart occurred in September-2018 and July-1999. In the first case, the peak in the SPX/gold ratio preceded the SPX’s nominal dollar peak by about 16 months (the SPX didn’t peak in dollar terms until February-2020). In the second case, the peak in the SPX/gold ratio preceded the SPX’s nominal dollar peak by about 8 months (the SPX peaked in dollar terms in March-2000).

The most recent peak in the SPX/gold ratio occurred at the beginning of December-2021. Based on what’s happening on the monetary and economic fronts, we think that this will turn out to be a major top (a top that holds for at least 3 years). At this stage, however, what we have is a pullback to the 200-week MA, which would be consistent with either an intermediate-term correction within an on-going major upward trend or the first leg of a new major downward trend.
The point we want to make today is that even if the decline over the past three months of the SPX/gold ratio was the first leg of a new major downward trend (the most likely scenario, in our opinion), it would not be out of the ordinary for the SPX to make a new all-time high in dollar terms during the second half of this year or the first half of 2023.
 Print This Post
