[This blog post is an excerpt from a report recently published at TSI]
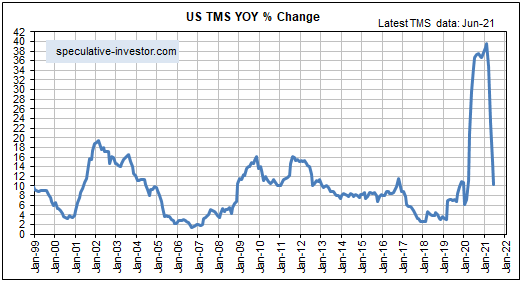
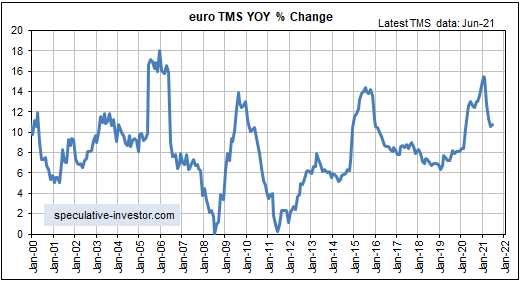
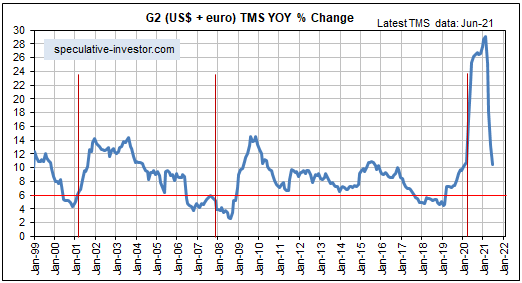
The spectacular rise in the money supply growth rate that began in March of last year predictably led to an equally spectacular decline after the effects of the central banking world’s initial frenzied response to the ‘coronacrisis’ dropped out of the year-over-year calculations. Displayed below are charts showing the spectacular declines over the past few months in the monetary inflation rates of the US, the euro-zone and the G2 (the US plus the euro-zone).
Note that the steep declines probably will continue for one more month, after which the year-over-year growth rates should level out. Also note that the vertical red lines on the G2 monetary inflation chart indicate the starting times of US recessions.


As mentioned in previous TSI commentaries, the monetary backdrop will stop being supportive for the US stock market after the annual TMS growth rate drops below 6%. This could happen as soon as the first quarter of next year, but a lot will depend on commercial bank lending. For example, if commercial banks ramp-up their lending then the US monetary inflation rate could stay in the 7%-10% range for a long time even if the Fed ‘tapers’. Something along these lines happened during 2014-2016.
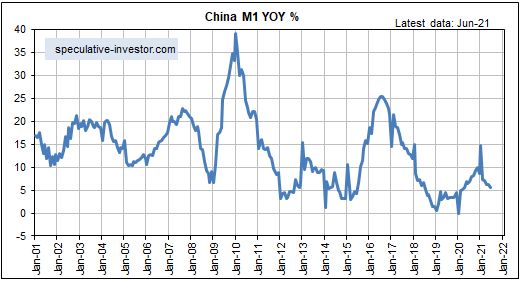
The monetary situation in China is very different. As illustrated by the following chart, the year-over-year growth rate of China’s M1 money supply is close to a multi-decade low.
All else remaining the same, the relatively small amount of monetary inflation in China over the past 16 months would pave the way for China’s economy to be relatively strong over the next few years. However, all else isn’t remaining the same, in that the Communist Party of China (that is, Xi Jinping) is becoming increasingly dictatorial and heavy-handed in its dealings with the private sector.

We’ve written previously that the H1-2021 global monetary inflation reversal probably won’t be a major driver of prices over the balance of this year. This is due to the time it takes for a change in the money-supply growth trend to ‘ripple through’ the financial markets and the economy. However, unless the Fed and the ECB generate a new monetary tsunami over the next several months, the G2 monetary inflation rate could become low enough by early next year to set off a boom-to-bust transition.
 Print This Post
