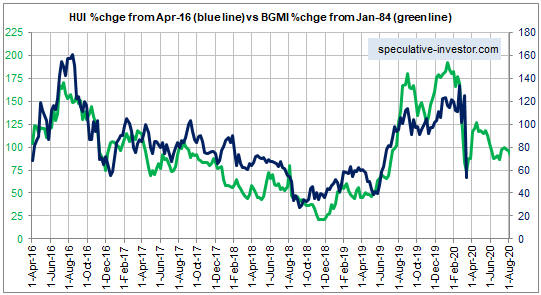
In TSI commentaries since May-June last year I have been tracking the current performance of the gold mining sector with its performance during the mid-1980s. More specifically, I have been comparing the current HUI with the mid-1980s Barrons Gold Mining Index (BGMI). The chart that illustrates this model is displayed below.
The model predicted the rapid rise in the HUI during June-August of last year, the steep correction from a peak by early-September to an October-November low, the rise to a new multi-year high by January-2020 and the crash to a low in March-2020. The big predictions associated with this model are now in the past, which is why I can take the liberty of including it in a free blog post.

The main point I want to make with this post is that even though the present often looks very different from any previous time, the bulk of what happens in the financial markets has happened before. It’s often just a matter of finding the right historical comparison, which is always easier said than done. Also, valid comparisons with previous times always have limited lifespans. It’s possible, for example, that my comparison with the mid-1980s has almost reached the end of its useful life.
Knowledge of how markets have performed in the past, including the distant past (not just the preceding 10-20 years), is useful even if it doesn’t lead to a specific history-based model. For example, anyone with knowledge of market history knows that when the gold mining sector is stretched to the upside near the start of a general stock market crash, it always crashes with the broad market. As far as I know, there have been no exceptions.
History informs us that after a crash comes a rebound and after a rebound there is usually a test of the crash low.
 Print This Post
