[In a blog post last October I mentioned that a recent divergence between the gold/commodity ratio and the T-Bond price had bullish implications for the T-Bond. A strong rebound in the T-Bond soon got underway. Another divergence between the gold/commodity ratio and the T-Bond price has since developed, this time with bearish implications for the T-Bond. A discussion of the most recent divergence was included in a TSI commentary published on 28th March and is reprinted below.]
The gold/commodity (g/c) ratio and the T-Bond price tend to move in the same direction. As previously explained, this tendency is associated with what Keynesian economists call a paradox (“Gibson’s Paradox”) and Austrian economists call a natural and perfectly understandable consequence of the relationship between time preference and prices. The reason for revisiting the gold-bond relationship today is that a significant divergence developed over the past three months and such divergences are usually important.
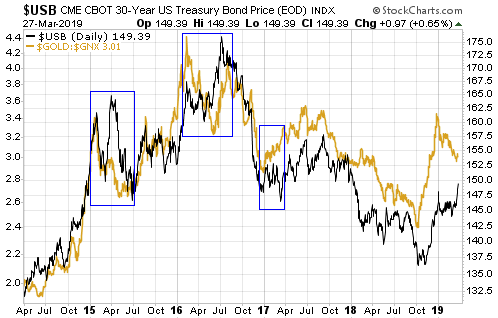
The following chart illustrates our point that the gold/commodity ratio (the US$ gold price divided by the GSCI Spot Commodity Index) and the T-Bond price move in the same direction most of the time. It also shows that over the past three months the two quantities have diverged, with the g/c ratio trending downward while the T-Bond price extended its upward trend and moved to a marginal new 12-month high.
Given that the relationship between the g/c ratio and the T-Bond has a solid fundamental basis, that is, given that it’s not a case of random correlation, it should continue to apply. Therefore, we expect that the divergence will close over the months ahead — via either a rise in the g/c ratio to above its December-2018 high or a decline in the T-Bond price to well below its February-2019 low.

The divergence probably will close via a decline in the T-Bond price, because if there is a leader in this relationship it is the g/c ratio. For example, in each of the three biggest divergences of the past five years (the areas inside the blue boxes drawn on the above chart), the g/c ratio reversed course months in advance of the T-Bond. The g/c ratio also led the T-Bond by 2-3 months at the Q3-2017 top and by a couple of weeks at the Q4-2018 bottom. In other words, the recent performance of the g/c ratio is a reason to be intermediate-term bearish on the T-Bond.
One realistic possibility is that the T-Bond is now topping similarly to how it bottomed between December-2016 and March-2017. Back then, both the g/c ratio and the T-Bond turned up at around the same time (in late December of 2016), but whereas the g/c ratio trended upward throughout the first quarter of 2017 the T-Bond made a marginal new low in March before commencing an upward trend of its own. This time around the g/c ratio and the T-Bond turned down at around the same time (in late December of 2018), but whereas the g/c ratio has continued along a downward path the T-Bond has risen to a marginal new multi-month high.
 Print This Post
