Sidebar right

Still not much monetary inflation in Japan

August 22, 2014

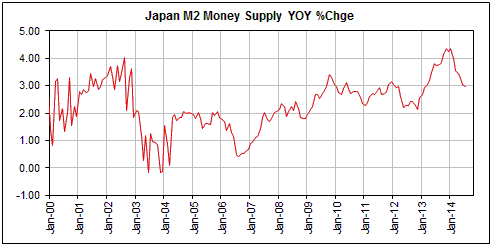
A popular view is that the Bank of Japan (BOJ) is inflating the Yen to oblivion. This view is wrong. The reality is that while there is certainly a risk that the BOJ will eventually inflate Japan’s money supply at a fast pace, it is not currently doing so.

The spectacular QE program introduced by the BOJ in April of last year did have some effect on the money supply, but the effect was nowhere near as great as generally believed. As illustrated by the chart displayed below, the year-over-year (YOY) rate of increase in Japan’s M2 money supply rose from around 3% in early-2013 to just above 4% near year-end, but 4% is a long way from the explosive growth that most analysts thought would result from the BOJ’s new Yen-depreciation policy. Furthermore, the YOY rate of increase in Japan’s M2 has since drifted down to 3% and appears to be on its way back to the long-term average of 2% (I think it will be back at 2% by October). This means that Japan is still maintaining the world’s lowest monetary inflation rate, which prompts me to ask: Why are so many analysts still blindly assuming that the BOJ is rapidly expanding the Yen supply? Why aren’t they spending the 15 minutes that would be needed to validate — or in this case invalidate — their assumptions by checking the money-supply figures available at the BOJ web site?

An implication of the above is that the supply side of the Yen’s supply-demand equation remains bullish for the Yen’s exchange rate. However, for most currency traders this doesn’t matter. The reason is that the supply side dominates very long-term trends in the foreign exchange market, but the demand side often dominates over periods of up to 2 years.

Print This Post Print This Post
T-Bonds are still defying almost everyone’s expectations

August 19, 2014

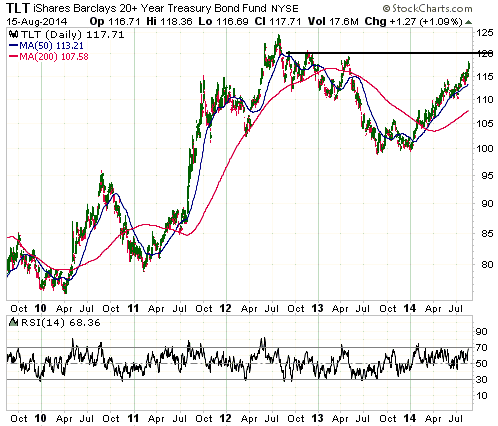
One of the main reasons that T-Bonds continue to rise in price (fall in yield) is that most speculators continue to bet on a price decline (a rise in long-term interest rates). In other words, the sentiment backdrop remains supportive. It’s worth noting, for example, that despite the strong and consistent upward trend of the past 9 months, there is still a substantial speculative net-short position across the 30-year T-Bond and 10-year T-Note futures markets. Therefore, higher T-Bond/T-Note prices and lower long-term interest rates probably lie in store.

That being said, the iShares 20+ Year Treasury ETF (TLT) is now a) very ‘overbought’ by some measures (momentum, not sentiment), b) within 2% of intermediate-term resistance at 120, and c) within 6% of its mid-2012 all-time high. A test of resistance at 120 will almost surely happen and a test of the all-time high will possibly happen prior to the next intermediate-term peak, but a sustained break into all-time-high territory is very unlikely.

TSI was short-term bullish on US Treasury bonds from mid-December of last year through to mid-August of this year, but turned short-term “neutral” in a report published on 17th August. I expect to see additional gains in the T-Bond price and additional declines in the T-Bond yield over the next few months, but the short-term risk/reward is no longer skewed towards reward. It is also not skewed towards risk, meaning that it doesn’t yet make sense to bet against this market.

Print This Post Print This Post
The coming mother-of-all economic busts

August 18, 2014

The extent to which monetary stimulus weakens an economy’s foundations and gets in the way of real progress will be proportional to the aggressiveness of the stimulus. This is because the greater the monetary stimulus, the greater the part within the overall economy that will end up being played by ‘bubble activities’ (businesses, projects, investments and speculations that only seem viable due to artificially low interest rates and a constant, fast-flowing stream of new money). That’s why the unprecedented (at that time) monetary stimulus of 2001-2005 led to the most severe economic fallout in more than 50 years, and why the even more over-the-top monetary stimulus of 2008-2013 has paved the way for an economic downturn of even greater severity than that of 2007-2009.

I’ll be writing more about the coming economic bust (aka severe recession or depression) over the next several months, especially if signs appear that it will soon get underway. For now, here are a few preliminary thoughts:

1) The next economic bust is likely to be worse than, and different from, the one that occurred during 2007-2009. What I mean is that the next bust is unlikely to be an amplified version of what happened previously. The main reason is that almost everyone, including the monetary central planners, will be prepared for a repeat of 2007-2009. Of particular relevance, whereas the Fed didn’t start to pump money into the economy until almost 12 months after the start of the 2007-2009 financial crisis and economic recession (the Fed began to cut its targeted interest rate in September of 2007, but it didn’t begin to monetise assets in a way that boosted the monetary inflation rate until September of 2008), it’s likely that the next time around the Fed will be much quicker to ramp up the money supply.

2) Due to the much quicker application of monetary ‘accommodation’ to counteract future economic weakness, the next bust could be associated with sharply rising commodity prices. This would be due to commodity hoarding in reaction to the belief that money is being trashed.

3) In the lead-up to and during the next economic bust, gold will probably be the best investment because it is the most logical commodity for large investors to hoard. It is the most logical commodity-refuge due to its global liquidity, its globally recognised value, the fact that the amount of gold used in commercial/industrial applications is trivial compared to the amount of gold held for monetary/investment/speculative purposes, and the distinct possibility that a collapse of or an existential threat to the current monetary system would result in gold returning to its traditional role as money.

4) The next economic bust won’t be caused by a geopolitical event, such as the disintegration of Ukraine and/or Iraq, but it will likely be exacerbated by restrictions placed on international trade due to increasing geopolitical tension.

5) The timing of the next bust is currently unknown. Two years ago I thought that it would be well underway by now, but it’s clear that negative real interest rates have a remarkable ability to postpone the day of reckoning. My current guess is that it will begin in 2015.

6) Three things I expect to see shortly before the start of the next economic bust are: a) the S&P500 Index dropping well below its 200-day moving average; b) evidence across the financial markets of a general increase in risk aversion (e.g. widening credit spreads, strength in gold relative to most other commodities); and c) a decline in the US monetary inflation rate to below 7%.

Print This Post Print This Post

Beware the “streaming” deal!

August 17, 2014

Here’s something I wrote at TSI last April:

In a market environment where debt and equity financing is often either expensive or difficult for a junior gold (or silver) miner to obtain, a streaming deal can look attractive. This is a deal whereby a miner sells the right to purchase part of its future production at a very low price (usually no more than $400/oz for gold) in exchange for an upfront payment, with the upfront payment generally being used to finance the development or expansion of a mine. The company buying the future production “stream” will typically be Franco Nevada (FNV), Royal Gold (RGLD), Silver Wheaton (SLV) or Sandstorm Gold (SAND).

While a “streaming” deal can look like a reasonable way for a junior miner to meet its short-term financing needs at the cost of reduced future profitability, the risk is that by entering into the streaming deal the junior miner has completely relinquished its opportunity to make a profit in the future. This is because most gold mines have slim profit margins after all costs are accounted for. Due to these typically-slim margins, a miner that agrees to sell 10%-20% of its future production to a royalty or streaming company at a nominal price could end up with nothing for its own stockholders even if it doesn’t encounter major operational problems. In effect, the mine could end up being operated solely for the benefit of the royalty/streaming company.

The upshot is: beware of junior mining companies that have entered into streaming deals. Before you invest in such a company, make sure that there will be plenty of money left over for the stockholders of the junior miner after the royalty/streaming company has taken its share and ALL costs are taken into account. And bear in mind that Franco Nevada, Royal Gold and Silver Wheaton have very high valuations for a reason. The reason is that they tend to get the better of these deals.

I was reminded of this by the “streaming” deal announced by True Gold Mining (TGM.V) last week. TGM is a stock I’m long. The stock market is less concerned than I am about the negatives of streaming deals, but I wish that TGM’s management had opted for a different method of financing the construction of the Karma gold mine.

Print This Post Print This Post

More thoughts on speculators versus commercials in the gold market

August 15, 2014

In the gold market, the Commercials are NOT the proverbial “smart money” with respect to forecasting price direction. If they were then they wouldn’t have been net-short gold futures, to one degree or another, during the entire 2001-2011 upward trend in the gold price.

The Commercials are also not the “dumb money” with respect to forecasting price direction. This is because, as a group, they do not bet on price direction. Instead, they generally attempt to make money on spreads and commissions, regardless of price direction. Furthermore and as previously explained, the Commercial position in the futures market is simply the inverse of the Speculative position. In order for speculators, as a group, to increase their long exposure and drive the price upward, the Commercials, as a group, MUST increase their short exposure. A rise in the Commercial net-short position to a high level is therefore a function of basic mathematics — a necessary offset to a rise in the speculative net-long position to an equivalent high level. We realise that this assessment has the disadvantage of being nowhere near as interesting as the idea that Commercial traders are conspiring to keep a lid on the gold price, but it has the advantage of being factually correct.

Recently, the relatively high speculative net-long position (and the offsetting relatively high Commercial net-short position) in gold futures has been acting as a bearish hook. The problem for the short-term bears who are ‘hanging their hats’ on the COT data is that while it is correct to view a sharp rise in the speculative net-long position as a sign that the market is short-term ‘overbought’ and vulnerable to a significant pullback, there are no absolute benchmarks when it comes to the COT sentiment indicator (that’s all it is: a sentiment indicator). So, although the recent peak of 166K contracts in the total speculative net-long position in Comex gold futures is high relative to where this indicator has been over the past year, it could be low relative to where this indicator goes over the next two months. It’s possible, for example, that a rally in the gold price to the low-$1400s within the next two months will be accompanied by a rise in the total speculative net-long position to 250K contracts. Imagine how bearish the COT-focused analysts will be if that happens!

Print This Post Print This Post

Speculators versus Commercials in the gold market

August 12, 2014

Speculators, not commercial traders, drive price trends in the gold market. The proof of this is the simple fact that the speculative net-long position in gold futures almost always trends in the same direction as the gold price (an increase in the speculative net-long position almost always accompanies an increase in price and a decrease in the speculative net-long position almost always accompanies a decrease in price). It is therefore fair to say that in the gold market, speculators are price makers and commercials are price takers.

An example is the 2-week period ended 1st July 2014. During this period a definitive upward reversal in the short-term price trend coincided with a large increase in the speculative net-long position. Specifically, the price quickly rose from $1272 to $1328 while the speculative net-long position in COMEX gold futures jumped by about 80K contracts.

As dictated by basic arithmetic, the 80K-contract increase in the speculative net-long position during the 2-week period ended 1st July went hand-in-hand with an 80K-contract increase in the commercial net-short position. These changes in the speculative and commercial positions are two sides of the same coin. One would not be possible without the other.

In general terms, speculators, as a group, could never increase their long exposure to gold futures unless commercial traders (primarily bullion banks), as a group, were prepared to take the other side of the trade and increase their short exposure to gold futures, and speculators could never reduce their net-long position (or become net-short) unless commercials were prepared to reduce their net-short position (or become net-long). This means that those commentators who rail against the short-selling of gold futures by bullion banks and other commercial traders are effectively railing against the buying of gold futures by speculators.

Moving on, a superficial comparison of the gold price and the commercial net-position in gold futures could lead to the conclusion that the commercials are always on the wrong side of the market, except at short-term price extremes. For example, ‘the commercials’ were relentlessly net-long during the final six years of gold’s 1980-2001 secular bear market and have been relentlessly net-short since the beginning of gold’s secular bull market. Looking only at futures positioning could therefore lead to the impression that the commercials have lost a fortune trading gold, but such an impression would be wrong. The reality is that the bullion banks (the biggest commercial traders) generally don’t care which way the gold price trends, because they generally don’t make their money by betting on price trends. Instead, their goal is to make money regardless of price direction by taking advantage of spreads (for example, spreads between the cash and futures prices and spreads between different futures contracts) and the charging of commissions.

Print This Post Print This Post

Evidence of manipulation?

August 11, 2014

The following chart from Kitco.com shows how gold traded during three 24-hour periods: 4th August, 5th August and 6th August. The green line shows the 6th August trading and is the line in which we are interested.

Notice the near-vertical surge beginning at 8.00am NY Time on 6th August. This represents a sudden increase in buying from ‘out of the blue’.

When this type of price action happens in the opposite direction, that is, when a sudden increase in selling pressure causes a near-vertical price drop, it is always cited by some commentators as evidence of manipulation, but when the sudden price change or price acceleration is to the upside it is never cited as evidence of manipulation. Instead, it is supposedly due to gold’s bullish fundamentals coming to the fore. The logic (using the word very loosely) goes something like this:

1. Markets that are free of manipulation always move in synch with the fundamentals. (Reality: No, they don’t.)
2. Gold’s fundamentals are always bullish. (Reality: No, they aren’t. For example, gold’s fundamentals were bearish from mid-2012 through to mid-2013 and only turned unequivocally bullish in April-2014.)
3. Therefore, whenever the gold price falls it must be due to manipulation. (Reality: Two wrongs don’t make a right.)

The fact is that there are just as many sudden, ‘inexplicable’ price rises in the gold market as there are sudden, ‘inexplicable’ price declines, but the manipulation-centric bloggers and newsletter writers only tell you about the latter. Also, experienced traders know that these sudden and often-unpredictable price moves happen in ALL commodity futures markets.

Print This Post Print This Post

Future “inflation” and the Fed’s madness

August 10, 2014

Prior to 2002 the Fed would tighten monetary policy in reaction to outward signs of rising “price inflation” and loosen monetary policy in reaction to outward signs of falling “price inflation”, but beginning in 2002 the Fed became far more biased towards loose monetary policy. This bias is now so great that it seems as if the Fed has become permanently loose.

The following chart comparing the Fed Funds Rate (FFR) target set by the Fed with the Future Inflation Gauge (FIG) clearly illustrates the change in the Fed’s tactics over the past two decades. The Future Inflation Gauge is calculated monthly by the Economic Cycle Research Institute (ECRI) and should really be called the Future CPI Gauge, because it is designed to lead the CPI by about 11 months.

The chart shows that prior to 2002 the FFR tended to follow the FIG. After the FIG warned of rising “price pressures” the Fed would start hiking the FFR, and after the FIG started signaling reduced upward pressure on the CPI the Fed would start cutting the FFR. (Note: My chart begins in 1994, but the relationship between the FFR and the FIG that I just described goes back much further.) During 2002-2004, however, the Fed not only didn’t hike its targeted interest rate in response to a sharp increase in the FIG, it continued to cut the FFR.

The Fed’s decision to maintain an ultra-loose stance during 2002-2004 was the fuel for the real estate investment bubble and set the stage for the collapse of 2007-2009.

There was a lesson to be learned from what happened during 2002-2007, but the Fed clearly learned the wrong lesson. The lesson that should have been learned was: Don’t provide monetary fuel for bubble activities, because the eventual economic fallout will be devastating. Unfortunately, the lesson that was actually learned by the Fed was: An economic bust can be avoided forever by keeping monetary policy loose forever. The result is that the divergence between the FFR and the FIG that arose during the first half of the last decade is nothing compared to the divergence that is now in progress. The FIG has been working its way higher since early-2009 and just hit a 5-year high, while the Fed’s ZIRP (Zero Interest Rate Policy) remains firmly entrenched.

Zooming in on the shorter-term fluctuations, last year’s small decline in the FIG suggested that there wouldn’t be a significant increase in the CPI’s growth rate until at least the final few months of this year, while the rise in the FIG that began late last year suggests that “price inflation” will start to become apparent in the CPI during the final quarter of this year and could be perceived as a serious problem during the first half of next year. This probably means that by early next year the T-Bond bears will start to look correct and the Fed will start to feel irresistible pressure to begin a rate-hiking program. Unfortunately, the US economy is now so rife with ‘bubble activities’ (businesses, projects, investments and speculations that are only viable due to artificially low interest rates and a rapid stream of new money) that a severe downturn is likely to follow an attempt by the Fed to ‘normalise’ its monetary policy.

By ignoring investment bubbles and erring far more in favour of “inflation” than it has ever done in the past, the Fed has set the stage for the mother-of-all economic busts. If the bust doesn’t begin earlier it is likely to begin soon after the Fed starts to raise its targeted interest rate.

Print This Post Print This Post

Relative popularity as international ‘money’

August 6, 2014

A lot of nonsense has been written over the past several years, and continues to be written, about a general shift away from the US$ towards alternatives such as the euro and the Yuan. For record purposes, here are some facts:

1) Shares of global trade settlement, according to SWIFT (Society for Worldwide Interbank Financial Telecommunication):
- In June-2014 the US dollar’s share was 40.2%, which is UP from 29.7% in January-2012
- In June-2014 the euro’s share was 31.3%, which is DOWN from 44% in January-2012
- In June-2014 the Yuan’s share was 1.5%, which is UP from 0.3% in January-2012

2) Shares of global FX turnover, according to the BIS:
- In 2013 the US dollar’s share was 87.1%, which is UP from 84.9% in 2010
- In 2013 the euro’s share was 33%, which is DOWN from 39% in 2010
- In 2013 the Yuan’s share was 2.2%, which is UP from 0.9% in 2010

So, the US$ has gained in popularity over the past few years as an international medium of exchange for use in both trade and investing. The Yuan has also gained in popularity, but none of its gain has come at the expense of the US$ and its share of global trade and capital flows remains trivial. The euro has been the big loser.

Print This Post Print This Post