Sidebar right

The “war on cash” has nothing to do with fighting crime

January 17, 2017

Don’t be hoodwinked by the relentless propaganda into believing that the efforts being made to eliminate physical cash are motivated by a desire to reduce crime and corruption. Fighting crime/corruption is just a pretext.

The logic behind the propaganda goes like this: Criminals often use physical cash in their dealings, therefore cash should be eliminated. This makes as much sense as saying: Criminals often use cars, therefore cars should be banned. From an ethical standpoint, the fact that criminals use an item will never be a good reason to prevent law-abiding citizens from using the item.

That being said, the anti-cash propaganda is not just wrong from an ethical standpoint; it is also wrong from a utilitarian standpoint if we assume that the stated reasons (to reduce the amount of crime and strengthen the economy) are the real reasons for wanting to eliminate physical cash. This is because neither logic nor historical data provide any basis for believing that forcibly reducing the use of physical money will reduce crime or boost the economy.

With regard to the crime-fighting claim, yes, criminals often use cash due to cash transactions being untraceable, but no criminal is going to change his ways and ‘go down the straight and narrow’ in response to physical money becoming obsolete. If physical money were eliminated then genuine criminals would find some other way of doing their financial transactions. Perhaps they would start using gold, which would give governments a pretext for the banning of gold. Or perhaps they would use Bitcoin, which would give governments a pretext for the banning of Bitcoin. The point is that there will always be many media of exchange that could be used by genuine criminals to conduct their business. The banning of cash would only be a short-lived and relatively-minor inconvenience to this group.

The economy-strengthening claim stems from the crime-fighting claim, in that all else being equal a change to the monetary system that resulted in less genuine crime (the only genuine crimes are those that result in the violation of property rights) would lead to a stronger economy. Since there is neither a logical reason nor a reason based on the historical record to expect that banning physical cash would lead to less genuine crime, the economy-strengthening claim is baseless.

On a side note, if the elimination of physical cash would actually provide a benefit to the overall economy, that is, if it would result in a higher average standard of living, then it is something that would happen without government intervention. In general, a greater amount of government economic intervention is only ever required when the desired change will NOT create a net benefit for the overall economy.

The reasons being put forward for the elimination of cash are therefore bogus. What, then, are the real reasons?

The main real reason is to maximise tax revenue. If all transactions are carried out electronically via the banking system then every transaction can be monitored, making it more difficult to avoid tax. In other words, the main reason that governments are very keen to eliminate physical cash is that by doing so they increase the amount of money flowing into government coffers. Unless you believe that the government generally uses resources more efficiently than the private sector you must acknowledge that this would result in a weaker rather than a stronger economy.

There is, however, an important secondary reason for the forced shift towards a cashless society, which is that it would help the banks in two ways.

First, it would help the banks by ensuring that 100% of the economy’s money was always in the banking system. Currently about 90% of the money in developed economies is in the banking system, with a physical float (currency in circulation outside the banking system) making up the remaining 10% of the money supply. The move to eliminate physical cash can therefore be thought of as the banking industry going after the final 10% of the money supply.

Second, it would ensure that there was no way for the public to avoid the cost of negative interest rates or any other draconian charge on monetary savings/transactions implemented by the banking establishment. Any single member of the public could avoid the charge, but only by transferring money — and the associated liability — to another person’s account.

So, any economist or financial journalist who advocates the elimination of physical cash is clueless at best and a government/banking-system stooge at worst.

Print This Post Print This Post
A wide-angle view of the US stock market

January 14, 2017

Here is an excerpt from a recent TSI commentary:

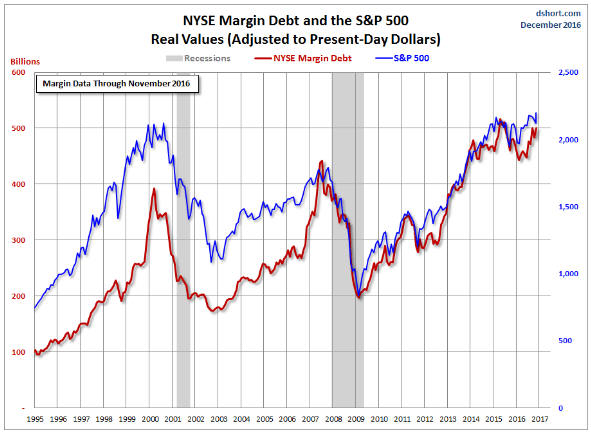
Until the S&P500 Index (SPX) broke out to the upside in early-July of 2016 we favoured the view that an equity bear market had begun in mid-2015. Supporting this view was the performance of NYSE Margin Debt, which had made what appeared to be a clear-cut downward reversal from an April-2015 peak.

As we’ve explained in the past, leverage is bullish for asset prices as long as it is increasing, regardless of how far into ‘nosebleed territory’ it happens to be. It’s only after market participants begin to scale back their collective leverage that asset prices come under substantial and sustained pressure. For example, it was a few months AFTER leverage (as indicated by the level of NYSE margin debt) stopped expanding and started to contract that major stock-market peaks occurred in 2000 and 2007. That’s why, during the second half of 2015 and the first few months of this year, we considered the pronounced downturn in NYSE Margin Debt from its April-2015 all-time high to be a warning of an equity bear market.

As at the end of November-2016 (the latest data) NYSE Margin Debt still hadn’t exceeded its April-2015 high, but the following chart from Doug Short shows that it is close to doing so. Furthermore, given the price action in December it is likely that NYSE Margin Debt has since made a new all-time high.

Even if it didn’t make a new high in December, the rise by NYSE Margin Debt to the vicinity of its April-2015 peak is evidence that leverage is still in a long-term upward trend and that the equity bull market is not yet complete.

More timely evidence that the US equity bull market is not yet complete is provided by indicators of market breadth, the most useful of which is the number of individual stocks making new 52-week highs.

The number of individual stocks making new highs on the NYSE and the NASDAQ peaked with the senior stock indices at multi-year highs during the first half of December. The number of individual-stock new highs has since fallen sharply, but this is normal and is not yet a significant bearish divergence.

The change over the past 6 weeks in the number of individual stocks making highs is consistent with the view that a sizable short-term decline is coming, but at the same time it suggests that neither a long-term top nor an intermediate-term top is in place. The reason is the strong tendency for the number of individual-stock new highs to diverge bearishly from the senior indices for at least a few months prior to an intermediate-term or a long-term top.

The US equity bull market may well continue, but that doesn’t mean it’s worth participating in. No investor should attempt to buy into all, or even into most, bull markets. In our opinion, it’s best to restrict participation to those bullish trends that are underpinned by relative value.

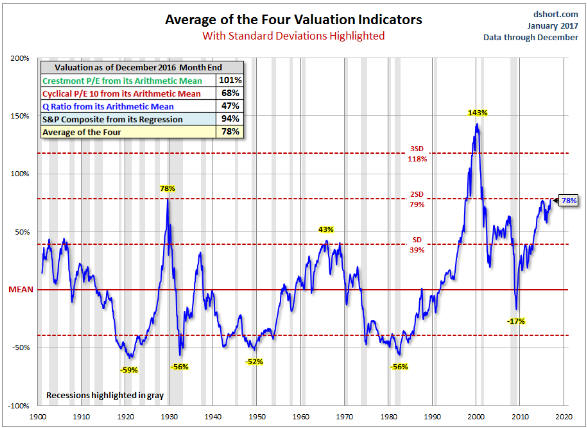
If the US equity bull market continues it will definitely not be because the market is underpinned by relative value. As illustrated by another chart from Doug Short (see below), based on an average of four valuation indicators the S&P500′s valuation today is the same as it was at the 1929 peak and second only to the 2000 peak.

The market has primarily been propelled by and to a certain extent remains underpinned by the combination of monetary inflation and artificially-low interest rates, that is, by the machinations of the Fed.

Print This Post Print This Post
Revisiting the gold market’s “London bias”

January 9, 2017

Whenever I write about gold-market manipulation in an effort to debunk the story that gold has been subject to a long-term price suppression scheme I am always careful to point out that ALL markets, including the gold market, are manipulated. They always have been and they always will be. Presenting evidence that the gold market is manipulated is therefore like presenting evidence that the Earth revolves around the sun — perfectly true, but not useful information in this day and age. However, whenever I write on the topic I invariably receive vitriolic responses in which I’m called a manipulation denier. Sigh.

The main point I was trying to make in last week’s blog post on this controversial topic is simply that evidence of gold-market manipulation is not evidence of long-term price suppression. Yes, if long-term price suppression has occurred then it would be an example of market manipulation, but market manipulation generally does not involve long-term price suppression. To further explain using an analogy, it’s a fact that a poodle is a dog, but armed with this fact it would be logically incorrect to point to an animal and say “that animal is a dog therefore it must be a poodle.” The animal might be a poodle, but there is a vastly greater probability that it is some other type of dog.

As far as I can tell, none of the evidence of market manipulation presented to date constitutes evidence of long-term price suppression. At best it falls into the “evidence that the Earth revolves around the sun” category — true, but not useful in this day and age. At worst it is designed to paint a misleading picture.

This brings me to the “London gold bias”, an issue that is often cited to support the long-term price suppression story.

I have been aware of the “London bias” in the gold market for a long time and dealt with it in a blog post about two years ago. It’s time to revisit the issue.

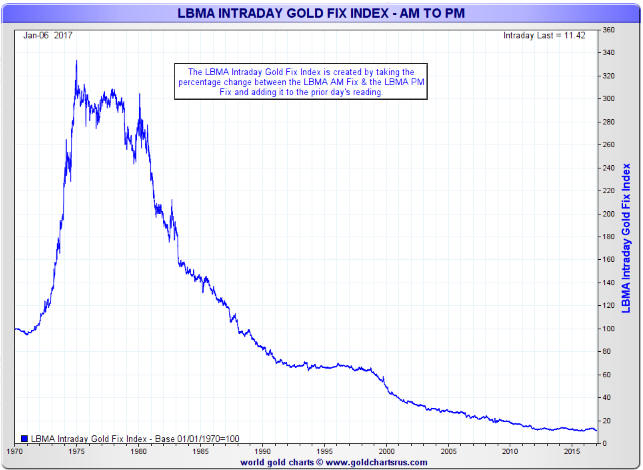
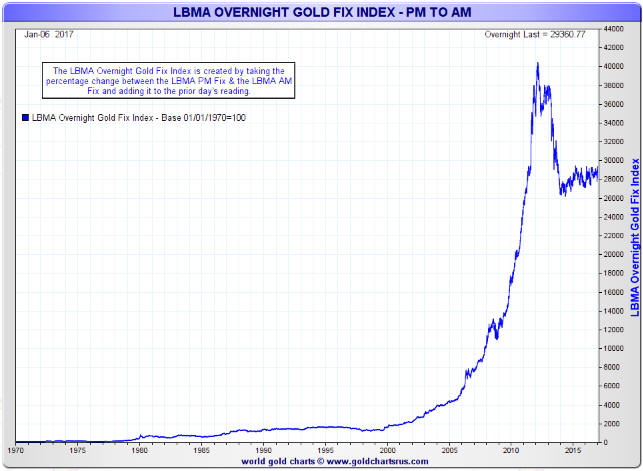
The idea behind the “London bias” is that there is a tendency for the London PM gold fix to be lower than the London AM gold fix. The result is that you would have lost money almost every year, through gold bull markets and gold bear markets, by simply buying a position at the London gold AM Fix every day and selling the position at the London PM Fix the same day. Here’s a chart from Nick Laird’s goldchartsrus.com web site illustrating the dismal performance that a hapless investor would have achieved if he had done exactly that:

Londonbiasdown_090117

That’s the type of chart that would be presented by someone who was keen to prove long-term price suppression. The thing is that by using exactly the same data a case could be made that the gold market has been subject to long-term price ELEVATION.

Here’s the backup for the above statement in the form of another chart prepared by Nick Laird, this time showing the performance that would be achieved by buying a position at the London gold PM Fix every day and selling the position at the London AM Fix the next day. This chart could be used to ‘prove’ upward manipulation of the gold price over a very long period.

Londonbiasup_090117

The first of the above charts can be used to support the claim that the gold price has been unjustifiably suppressed and the second could be used to support the opposite claim. Furthermore, the claim of long-term upward manipulation supposedly supported by the second chart has an advantage in that it assumes manipulation during a part of the day when the market is relatively illiquid. If you were intent on manipulating a price in a particular direction over the long-term, would you be more likely to act during the most-liquid part of the trading day, when shifting the price would be most costly, or during the least-liquid part of the trading day, when shifting the price would be least costly?

In no way do I believe that the gold market has been subject to a long-term price elevation scheme. My point is simply that it is possible to ‘mine’ the same set of data in order to substantiate diametrically-opposed preconceived conclusions.

Humans love to find patterns and there are all sorts of patterns to be found in gold’s price action and the price action of every other widely-traded commodity or financial asset. However, these patterns often aren’t tradable, because if they were then they would be traded and the effect of the trading would be to make the pattern disappear. For example, if gold has a strong tendency to fall between time A and time B each day then there is money to be made by repeatedly selling at time A and buying at time B, but doing this trade in significant size will raise the price at time B relative to the price at time A and eliminate the opportunity.

The very-short-term patterns in the gold market (the price rising at certain times and falling at certain other times during the day) must have cancelled each other out, because over the past 20 years the gold price has generally done what it should have done based on measures of economic and financial-market confidence (the true fundamental drivers of the gold price). Also, like most markets the gold market tends to overshoot in both directions, thus creating excellent profit-generating opportunities for investors and speculators who remain objective.

Print This Post Print This Post
China’s Incredible Smog

January 7, 2017

Global Warming, or Climate Change as it is now called, is not a problem. Earth’s climate has always been changing and will continue to do so, regardless of what anyone does. Pollution, however, is often a problem and in China the pollution problem has grown to the point where it could collapse the economy.

Here are a couple of Youtube videos that show the horrendous smog that engulfed Beijing over the past week. The commentary is in Chinese, but you don’t need to understand Chinese to understand what’s going on.

The first video shows several vehicle collisions caused by the near total lack of visibility on the road.

In the second video, a couple of guys stop their cars on the road due to the lack of visibility. They get out, walk a short distance and are then unable to find their way back to the cars. The video is obviously staged, but it does a good job of showing the absurdly-bad air quality.

How are China’s policy-makers going to deal with this without shutting down a lot of power plants and refineries and without substantially curtailing the use of cars, that is, without crashing the economy? I have no idea.

Print This Post Print This Post

Market manipulation is not price suppression

January 3, 2017

One of the most annoying claims made by manipulation-focused gold-market commentators is that evidence of market manipulation constitutes evidence of long-term price suppression. The claim is annoying not so much because it is obviously false, but because many people get fooled by it even though it is obviously false.

Experienced traders are well aware that banks and other large-scale operators regularly attempt to shift prices one way or the other in most financial markets to benefit their own bottom-lines. It has always been this way and it always will be this way. As I mentioned in previous blog posts (HERE, HERE and HERE, for example), when news emerges that banks have been caught manipulating prices in a market it isn’t really news at all.

Sometimes the manipulation is unethical and/or illegal (what’s illegal and what’s unethical aren’t always the same), but a lot of the price manipulation attempted by private operators in the financial markets is neither illegal nor unethical. A lot of the time it is a legitimate business practice.

From the perspective of manipulation-focused pontificators about gold, the big story over the past two years was the evidence that major banks had been scalping profits by manipulating the London Gold Fix. Deutsche Bank even settled lawsuits over allegations it manipulated gold and silver prices via the London Fix, thus providing plenty of grist for the conspiracy mill.

Assuming that banks were indeed using the twice-daily London Fix to manipulate gold prices, then in this case the manipulation was probably illegal and almost certainly unethical. If nothing else, it involved a breach of trust. However, as noted in a previous post on this topic the price manipulation that potentially occurred via the London Fix could only have affected prices by small amounts for very brief periods. Furthermore, the small effects would have been to both the upside and the downside.

The ‘news’ that banks used the London Gold Fix to illegitimately increase their profits is therefore completely irrelevant to the claim that there has been a successful price suppression scheme in operation in the gold market over a great many years. And yet, it has been portrayed as if it were the veritable “smoking gun” evidence of such a scheme.

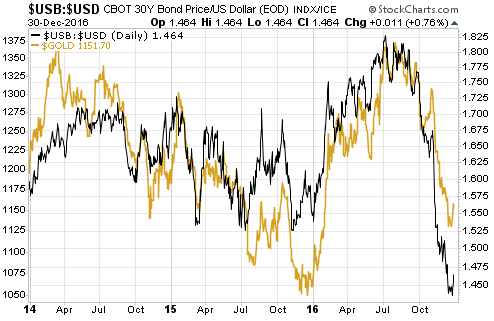
If the gold market had really been subject to price suppression over a long period then gold’s performance would be totally ‘out of whack’ with related financial markets. However, that is not the case. For example, the following chart shows the close relationship over the past three years between the US$ gold price and the bond/dollar ratio (the T-Bond price divided by the Dollar Index).

gold_USBUSD_020117

All of that being said, you are allowed to make money in the financial markets by doing something other than buying/owning gold. Therefore, if you truly believe that a powerful group has both the means and the motive to suppress the gold price then the solution is obvious: don’t buy gold.

Print This Post Print This Post

“Gold has peaked for the year”, revisited

December 30, 2016

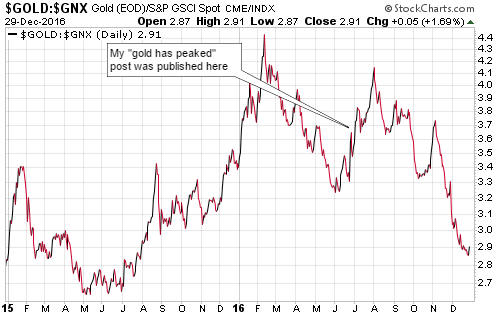
I published a blog post in late-June titled “Gold has peaked for the year“. In this post I argued that relative to other commodities (as represented by the Goldman Sachs Spot Commodity Index – GNX) gold’s peak for 2016 most likely happened in February. As evidenced by the following chart, I was correct.

gold_GNX_291216

The reason for this follow-up post is not to give myself a public ‘pat on the back’. I’ve made my share of mistakes in the past and I will make mistakes in the future. The sole reason for this post is the vitriolic response that my earlier article received.

My earlier article should not have been controversial. After all, the February-2016 peak for the gold/GNX ratio wasn’t just any old high, it was an all-time high. In other words, at that time gold was more expensive than it had ever been relative to commodities in general. Furthermore, it is typical for gold to turn upward ahead of the commodity indices and to subsequently relinquish its leadership.

With gold having outperformed to the point where it was at its highest price ever relative to the prices of other commodities and with other commodities likely to recover, saying that gold had probably peaked for the year in commodity terms should have been viewed as a statement of the bleeding obvious. It would have taken a financial crisis of at least 2008 proportions during the second half of 2016, that is, it would have taken an extremely low-probability financial-market outcome, to propel the gold/GNX ratio to new highs during the second half of the year. That some readers took my “Gold has peaked” article as an affront was therefore remarkable.

Remarkable, but not really surprising given that in the minds of some gold devotees the gold price is always too low. It doesn’t matter how high the price is or what’s happening in the world, the price is always about to skyrocket. The only obstacle in the way is a cabal of evil market manipulators that will soon be overwhelmed by the forces of good. And in any case, a financial crisis of at least 2008 proportions is always about to happen.

Gold’s poor performance during the second half of 2016 was consistent with what I refer to as the true fundamentals*. This means that it wasn’t the result of downward manipulation. That being said, the great thing about believing that market trends have almost nothing to do with “fundamentals” and almost everything to do with manipulation is that you never have to be wrong. If any market goes against you it was due to the distortive effects of manipulation rather than a fatal flaw in your analysis.

*The true fundamental drivers of the US$ gold price are, in no particular order: US credit spreads, the US yield curve, the real US interest rate, the relative strength of the US banking sector, the US dollar’s exchange rate and the general trend in commodity prices.

Print This Post Print This Post

Why the Trump Presidency will go down in history as a disaster

December 27, 2016

[This post is an excerpt from a recent TSI commentary]

There are three reasons that the Trump Presidency will very likely go down in history as a disaster for the US, only the last of which has anything to do with Trump. The first two reasons are inter-related in that they are primarily the consequences of distortions/imbalances created by the Federal Reserve.

Due largely to the aggressive interventions of the Fed, including the creation of trillions of dollars via QE programs and keeping interest rates pegged near zero for eight years, the mal-investment problem in the US economy today is more serious than the mal-investment problem that led to the “great recession” of 2007-2009. This means that the next recession will probably be even more severe than the previous episode. It is possible that the extension of ultra-easy monetary conditions combined with fiscal ‘stimulus’ in the form of tax cuts will delay the start of the next recession by another 6-12 months, but for no fault of Trump it will almost certainly happen on his watch.

Also due to the aggressive interventions of the Fed, the US stock, bond and real-estate markets are now valued at levels that all but guarantee terrible performance over the coming few years. As is the case with an economic recession, it is possible that the extension of ultra-easy monetary conditions combined with fiscal ‘stimulus’ in the form of tax cuts will delay the start of the coming period of terrible performance; however, for no fault of Trump there will very likely be bear markets in the major US asset classes during his first — and almost certainly only — Presidential term.

While the coming severe recession and the bearish trends in asset prices were bound to occur and clearly have nothing to do with Trump, it looks like Trump is unwittingly setting himself up to take the blame.

His one chance of avoiding blame and paving the way for a genuine recovery to be in progress by the time of the next Presidential election would have been to stay out of the way and allow a major liquidation of the mal-investments to happen during the first half of 2017. This would have enabled the blame for the debacle to be appropriately placed at the feet of the Fed and the preceding Administration. However, having previously (and correctly) chided the Fed for having created a “big, fat, ugly bubble”, it seems that the deadly combination of hubris and ignorance has convinced Trump that he can set in motion a long period of strong growth with no intervening painful purgation.

In summary, certain bad economic and financial-market outcomes are currently set in stone. What’s not set in stone is who gets the blame. Unfortunately, Trump appears to be positioning himself to take the blame for the economic damage caused by others.

Print This Post Print This Post

How the fundamental backdrop could turn bullish for gold

December 16, 2016

Here is an excerpt from a TSI commentary that was published about a week ago.

A cottage industry has developed around manipulation-focused gold commentary. In this industry, gold’s price changes are portrayed as the outcome of a never-ending battle between the forces of good and evil, with the evil side constantly trying to beat the price down and the good side constantly buying or holding. Also, in the world imagined by this industry the fundamental backdrop is always gold-bullish. The implication is that all price rises are in accordance with the fundamentals and all price declines are contrary to the fundamentals and likely the result of manipulation by the forces of evil.

In the real world, however, the fundamentals are always in a state of flux — sometimes bullish, sometimes bearish, and sometimes mixed/neutral. Furthermore, our experience has been that gold tracks fundamental developments more closely/accurately than any other market.

When the gold price was topping in July-August of this year, the fundamental backdrop wasn’t gold-bearish; it was neutral. The ‘fundamentals’ therefore didn’t signal a top, but they did indicate that additional gains in the gold price would not have been fundamentally-supported and would therefore have required a further ramp-up in speculative buying.

From early-July through to early-November the ‘true fundamentals’ shifted between being neutral to being slightly-bearish for gold and then back again (we thought they were slightly bearish from mid-September through to mid-October and otherwise neutral). They turned bearish, however, a couple of days after the US Presidential Election and since around mid-November have been their most bearish in at least three years.

The fundamental backdrop is now definitively gold-bearish because we have a) real interest rates in an upward trend and at a 6-month high in the US, b) US credit spreads immersed in a major contraction (indicating rising economic confidence), c) dramatic relative strength in bank stocks (indicating sharply-rising confidence in the banking/financial system), and d) the Dollar Index in a strong upward trend and near a multi-year high. Given these conditions, any analyst/commentator who is now claiming that the ‘fundamentals’ are bullish for gold is either clueless about gold’s true fundamentals or is trying to promote an agenda.

That’s the situation today, but the situation will change. In broad-brushed terms, here are the two most likely ways that the situation could change to become supportive of an intermediate-term gold rally:

1) Rising inflation expectations

US inflation expectations have been rising since 11th February and have been rising at a quickened pace since late-September, but since Trump’s election victory the rate of increase in nominal interest rates has exceeded the rate of increase in inflation expectations. This has brought about a rise in REAL interest rates.

In effect, over the past month economic growth expectations have risen faster than inflation expectations. This doesn’t make a lot of sense considering the plans of the Trump Administration, but when speculating in the financial markets we must deal with ‘what is’ rather than ‘what should be’.

It’s certainly possible that at some point over the next few months the markets will figure out that the combined plans of the US government and the Fed will lead to more “price inflation” than economic growth, resulting in a relatively fast increase in inflation expectations. As well as causing real interest rates to fall, this would result in a weaker US$ and a further steepening of the yield curve. All told, it would result in the fundamental backdrop becoming gold-bullish.

2) A banking crisis in Europe

The major banks around the world are intimately and intricately connected via their massive derivative books, so a banking crisis that began in Europe would not remain confined to Europe. It would lead to concerns about the profitability of US banks, which, in turn, would lead to relative weakness in bank stocks and a general shift towards safety. Interest rates on Treasury debt would fall faster than inflation expectations, resulting in a lower real interest rate in the US. Also, short-term interest rates would fall relative to long-term interest rates due to a flight to liquidity and the market beginning to anticipate a shift in the Fed’s stance, resulting in a steepening of the yield curve. The overall effect would be a fundamental backdrop that was gold-bullish.

Either of the above could happen within the next few months, but neither is happening now.

Print This Post Print This Post

The second most overbought market since 1980

December 13, 2016

By one measure, the Dow Industrials Index is now at its second-most ‘overbought’ level since 1980. The measure I’m referring to is the 14-day RSI (Relative Strength Index), a short-term momentum oscillator shown in the bottom section of the following Dow chart.

Dow_LT_121216

Being the most something-or-other (the most overbought/oversold, optimistic/pessimistic, etc.) since a distant past time often isn’t as important as it sounds. For instance, the only time since 1980 that the Dow’s daily RSI(14) was as high as it is today was in November of 1996 (interestingly, almost exactly 20 years ago), but nothing dramatic happened during the days, weeks or months that followed the November-1996 momentum extreme.

As illustrated below, a pullback to the 50-day moving average (MA) got underway within a few days of the momentum extreme, after which the Dow resumed its long-term advance. There was a more significant short-term pullback (to the 200-day MA) a few months later and an intermediate-term correction a few months after that (more than 8 months after the momentum extreme), but the bull market continued for another 3 years.

Dow_1996_121216

A short-term momentum extreme occurred at the price peak that was followed by the October-1987 stock market crash, but it is a lot more common for such extremes to be followed by nothing more serious than a routine multi-week correction. With measures of market breadth pointing to a 6-12 month extension of the bull market we probably won’t get anything more bearish than a routine multi-week correction within the next couple of months, although I admit that the near-vertical rally since the Presidential Election has me ‘on edge’.

Print This Post Print This Post

An Australian gold producer sells high and buys low

December 9, 2016

Blackham Resources (BLK.AX), a junior gold producer that has just begun to ramp-up production at a newly-commissioned mine in Western Australia, reported something interesting earlier this week. Having forward-sold about half of next year’s expected gold production a few months ago when the gold price was near its highs for the year, the company recently took advantage of gold’s price decline by closing-out the bulk of its forward sales. It did so by purchasing gold and delivering it into the forward sales contracts, thus realising a cash profit of A$6.3M.

In other words, having sold high during May-September, BLK’s management turned around and bought low over the past couple of weeks. Sell high, buy low. Sounds like a good strategy to me. More gold producers should try it.

gold_A$_081216

Print This Post Print This Post

The problem is a single central bank, not a single currency

December 5, 2016

The euro-zone appears to be on target for another banking crisis during 2017. Also, the stage is set for political upheaval in some European countries, a general worsening of economic conditions throughout Europe and widening of the already-large gaps between the performances of the relatively-strong and relatively-weak European economies. It’s a virtual certainty that as was the case in reaction to earlier crises/recessions, blame for the bad situation will wrongly be heaped on Europe’s experiment with a common currency.

The idea that economically and/or politically disparate countries can’t use a common currency without sowing the seeds for major problems is just plain silly. It is loosely based on the fallacy that economic problems can be solved by currency depreciation. According to this line of thinking, countries such as Italy and Greece could recover if only they were using a currency that they could devalue at will. (Note: The destructiveness of the currency devaluation ‘solution’ was covered in a previous blog post.)

The fact is that economically and politically disparate countries throughout the world successfully used a common currency for centuries up to quite recently (in the grand scheme of things). The currency was called gold.

The problem isn’t the euro; it’s the European Central Bank (ECB). To put it another way, the problem isn’t that a bunch of different countries are using a common currency; it’s that a central planning agency is attempting to impose the same monetary policy across a bunch of different countries.

A central planning agency imposing monetary policy within a single country is bad enough, in that it generates false price signals, foments investment bubbles that inevitably end painfully, and reduces the rate of long-term economic progress. The Federal Reserve, for example, has wreaked havoc in the US over the past 15 years, first setting the scene for the collapse of 2007-2009 and then both getting in the way of a genuine recovery and setting the scene for the next collapse. However, when monetary policy (the combination of interest-rate and money-supply manipulations) is implemented across several economically-diverse countries, the resulting imbalances grow and become troublesome more quickly. That’s why Europe is destined to suffer a monetary collapse well ahead of the US.

It should be kept in mind that money is supposed to be neutral — a medium of exchange and a yardstick, not a tool for economic manipulation. It is inherently no more problematic for totally disparate countries to use a common currency than it is for totally disparate countries to use common measures of length or weight. On the contrary, a common currency makes international trading and investing more efficient. In particular, eliminating foreign-exchange commissions, hedging costs and the losses that are incurred due to unpredictable exchange-rate fluctuations would free-up resources that could be put to more productive uses.

In conclusion, the problem is the central planning of money and interest rates, not the fact that different countries use the same money. It’s a problem that exists everywhere; it’s just that it is more obvious in the euro-zone.

Print This Post Print This Post

Every central bank wants a weaker US$

December 2, 2016

This post is an excerpt from a recent TSI commentary.

Every central bank in the world, including the US Federal Reserve, now wants a weaker US$, which proves that central banks can be overwhelmed by market forces even when they are united in their goals.

Central banks outside the US want a weaker US$ due to the long-term consequences of the actions that they themselves took many years ago to strengthen the US$. To put it another way, they now want to strengthen their own currencies against the US$ because their economies are suffering from the inevitable ill-effects of the currency-depreciation policies implemented at an earlier time. As discussed in the past, currency depreciation/devaluation is always counter-productive because it “engages all the hidden forces of economic law on the side of destruction, and it does so in a manner that not one man in a million will be able to diagnose.” It is still a very popular policy, though, because at a superficial level — the level at which most economists and all central bankers operate — it seems practical.

Unfortunately for the central banks that are now trying to prop-up their currencies relative to the US$, a central bank’s ability to weaken its currency is much greater than its ability to bring about currency strength. The reason is that weakening a currency can usually be achieved by increasing its supply, and if there is one thing that central banks are good at it’s creating money out of nothing. Actually, creating money out of nothing, and, in the process, engaging all the hidden forces of economic law on the side of destruction, is the ONLY thing they are good at.

The problem they are now facing is that once confidence in the currency has been lost, bringing about currency strength or at least a semblance of stability will generally require either a very long period of politically-unpopular monetary prudence or a deflationary depression. There is no quick-and-easy way to obtain the desired result.

The crux of the matter is that there is very little that central banks outside the US can now do in the short-term to stop the US$ from rising. The best they can do is to NOT inflate. Other than that, they should simply avoid the temptation to ‘do something’ and instead just wait for the current trends to exhaust themselves.

The US central bank also wants a weaker US$. This is because the senior members of the Fed operate at the same superficial level as their counterparts throughout the world. They see the direct, short-term positives that a weaker currency would bring to some parts of the economy, but are incapable of seeing the broader, longer-term and indirect negatives.

The difference is that the Fed actually has the power to create short-term weakness in the US$. It could, for example, surprise the world by not hiking its targeted interest rate in December. That would knock the Dollar Index down by at least a couple of points. To build on the decline it could then start emphasising the sluggishness of US industrial production and dropping hints that another QE program is coming.

Doing so would, however, be a reckless course of action even by Keynesian standards. The US dollar’s upward trend would be over, but at the cost of a total loss of credibility on the part of the Fed and breathtaking instability in the financial markets.

Once lost, confidence is difficult for a central bank to regain. The Fed is therefore now backed into a corner where for the sake of appearances it will have to take small steps in the direction of tighter monetary policy, even though it would prefer a weaker US$.

Print This Post Print This Post