Sidebar left

Testing time for gold stocks

December 17, 2014

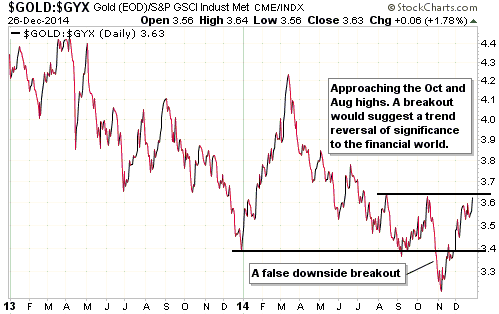
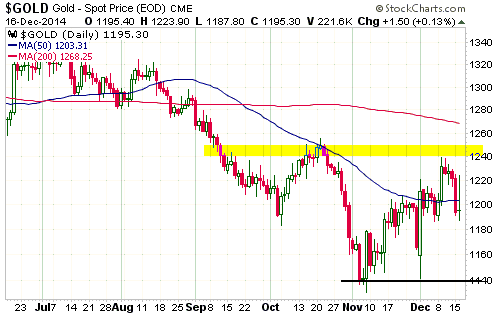
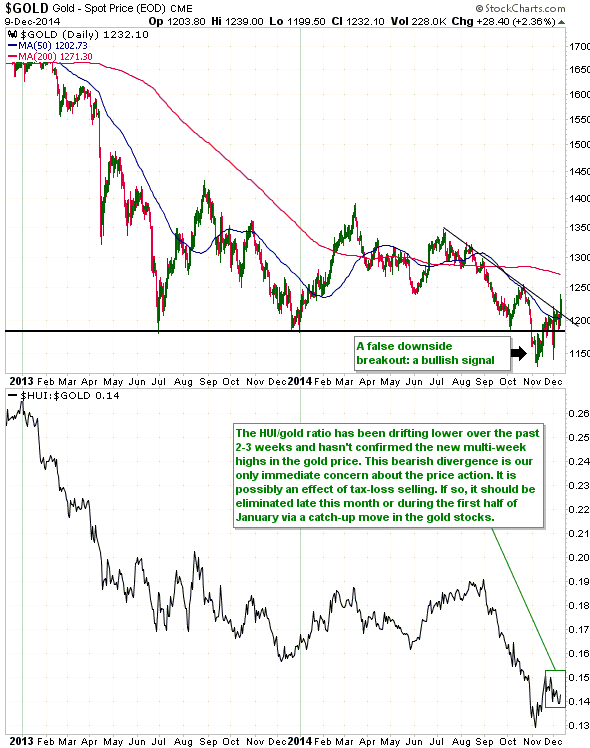
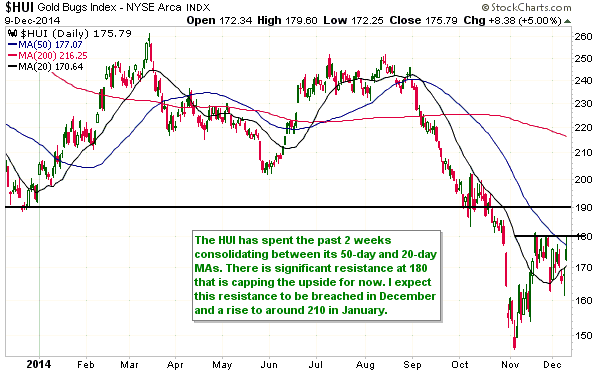
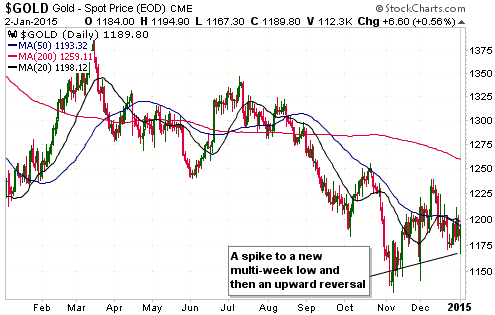
After gold and the gold-mining indices crashed during the final few days of October and the first few days of November, the most likely pattern over the weeks ahead was a rebound and then a successful test of the crash low. Gold bullion successfully tested its crash low on 1st December, but the gold-mining indices didn’t fall far enough at that time to complete a test. The reason is that by the time the North American stock markets opened for trading on 1st December, the gold price had already bounced off its early-November low and was rocketing upward.

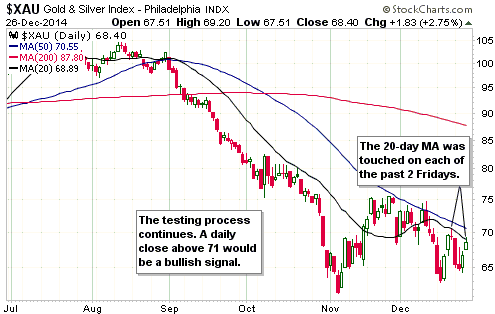
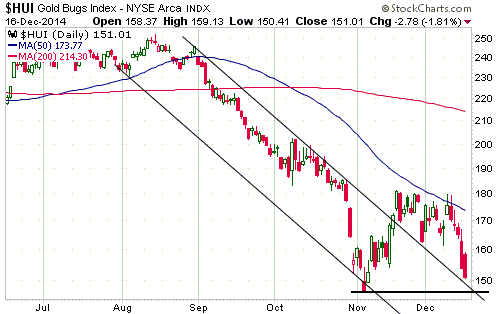
The 1st December price action indicated that the gold-mining sector might be able to avoid a test of its crash low, but it wasn’t to be. The HUI and the XAU have just closed lower for five days in a row and are now testing their early-November lows.

I expect the next up-day for the HUI, whether it be today (Wednesday the 17th) or tomorrow or the day after tomorrow, to mark the completion of a successful test of the early-November low and the start of a larger/longer rally than the initial post-crash rebound.

gold_161214

HUI_161214

Print This Post Print This Post

Russia’s stock market is very cheap, but…

December 16, 2014

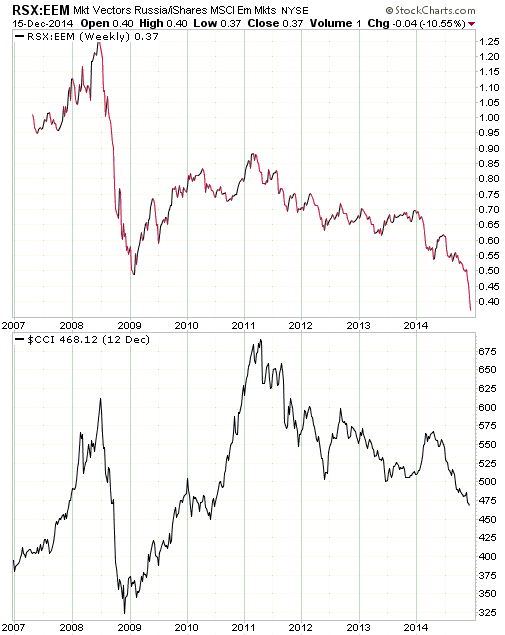
Based on Cyclically Adjusted PE (CAPE), Russia’s stock market is the second cheapest stock market in the world. Its current CAPE is around 5, compared to 27.9 for the US. By this measure only the Greek stock market is cheaper, but the Greek stock market has no dividend yield to speak of. Taking into account both CAPE and dividend yield, the Russian market is clearly the world’s cheapest (refer to http://www.starcapital.de/research/stockmarketvaluation for valuation data on many stock markets around the world). This means that it will probably generate outsized returns over the next few years. However, the following chart suggests that it won’t start providing relatively good returns until commodity prices begin trending upwards, regardless of how cheap it gets.

The chart shows that the RSX/EEM ratio (Russian equities relative to Emerging Market equities) trends with the Continuous Commodity Index (CCI). Russia is in the news a lot these days, due to geopolitical issues, economic sanctions and other economic problems, and, at the time of writing this post, a desperate effort to stop the devaluation of the Ruble by hiking the official interest rate from 10.5% to 17%, but it’s the trend in commodity prices that really matters.

RSX_EEM_CCI_161214

Print This Post Print This Post

How cheap are gold stocks, really?

December 15, 2014

This post is a modified excerpt from a commentary posted at TSI a few weeks ago.

At its recent low the HUI was trading at the same price at which it traded way back in 2003-2004, when the gold price was $350-$400/oz. On the surface, this suggests that at their recent lows the senior gold-mining stocks that dominate the HUI were absurdly under-valued relative to gold, given that gold was trading at around $1150/oz at the time. Just how extreme was the under-valuation?

According to the article posted HERE, the HUI’s under-valuation was so extreme it was completely irrational. For example, the article contains the following statements:

While gold stocks indeed should’ve been sold with gold weaker, the magnitude of selling they suffered was far beyond anything justifiable fundamentally. This ultimately culminated in the latest gold-stock capitulation where the HUI plunged to 11.3-year lows! Think about that a second. Gold stocks were just trading at prices not seen since July 2003. Pretty much the entire secular gold-stock bull had been fully erased.

And: “… [the] entire not-widely-followed gold-stock bull was based on the massive fundamental boost to gold-mining profits that gold’s own secular bull created. So if the recent gold-stock price levels were righteous, gold too should have been pounded back down towards its mid-2003 levels. Where was gold trading back then? Merely right around $350!

And: “Do gold stocks deserve to trade today as if gold was at just $350? Heck no! Last week when gold stocks’ latest capitulation low was carved, the gold price was up near $1150. That was 3.3x higher than the last time the gold stocks traded at recent levels! It makes no fundamental sense whatsoever for gold stocks to trade as if gold was at $350 when it was actually $1150. Their core fundamentals are now vastly better.

The analysis encapsulated in the above excerpts is superficial and misleading, for two main reasons. First, production costs are vastly higher now than they were in 2003-2004. Second, although the stock prices of the senior gold miners are, on average, not much higher now than they were when gold was trading at $350-$400/oz, their market capitalisations are hundreds of percent higher thanks to massive inflation of share quantities. Consequently, a good argument can be made that the “core fundamentals” are now worse than they were when the gold price was $350-$400.

I’ll now consider the specific case of Goldcorp (GG) to back-up my point. During the quarter ended 30th September 2003, GG managed to achieve a net profit of $0.13/share, a net operating margin of 44% and a return on invested capital (ROIC) of 22%. These results were achieved at an average realised sale price of $364/oz. During the quarter ended 30th September 2014 GG’s average realised sale price was $1266/oz, but the company reported a net LOSS of $0.05/share and was too embarrassed to highlight the ROIC. Note that there were no large asset writedowns in the latest quarter. GG was simply not profitable at $1266/oz in Q3-2014 after being very profitable at $364/oz way back in Q3-2003. And by the way, from Q3-2003 to Q3-2014 GG’s share count rose from 183M to 814M, so although its share price is up by ‘only’ about 50%, its market cap is up by about 580% over the period in question.

I selected GG for my quick-and-dirty case study because it has been one of the best-managed of the senior gold producers and has had less company-specific problems than some of its brethren. Had I chosen either Barrick Gold (ABX) or Kinross Gold (KGC) my point could have been made even more clearly, because the amount of wealth destroyed by these companies via ill-conceived acquisitions and project developments is mindboggling.

It’s important that fundamentals-oriented speculators who buy gold-mining stocks have their eyes wide open and understand the reality of the current situation. There are some good reasons to anticipate large gains in gold-stock prices over the coming 2 years involving a rising gold price, declining production costs and improving sentiment, but at the current gold price and with their current cost structures most gold producers are NOT particularly cheap by traditional valuation standards.

Therefore, don’t be hoodwinked by superficial comparisons into believing that gold stocks are now priced for a hundreds-of-dollars-per-ounce lower gold price and, as a consequence, that massive gains lie ahead for gold stocks even if the gold price flat-lines or continues to trend downward.

Print This Post Print This Post
Gold stocks during an equity bear market

December 12, 2014

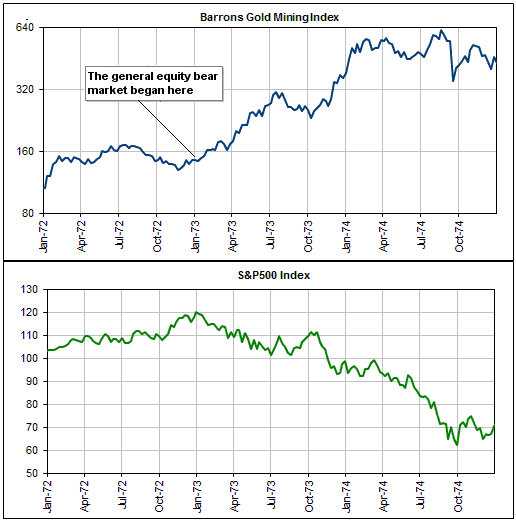
The historical record indicates that the gold-mining sector performs very well during the first 18-24 months of a general equity bear market as long as the average gold-mining stock is not ‘overbought’ and over-valued at the beginning of the bear market. Unfortunately, the historical sample size is small. In fact, since the birth of the current monetary system there have been only two relevant cases.

The first case involves the general equity bear market that began in January of 1973 and continued until late-1974. This bear market resulted in peak-to-trough losses of around 50% for the senior US stock indices.

The following chart comparison of the Barrons Gold Mining Index (BGMI) and the S&P500 Index shows that the gold-mining sector commenced a strong upward trend near the start of the general equity bear market. During the bear market’s first 20 months, the BGMI gained about 300%.

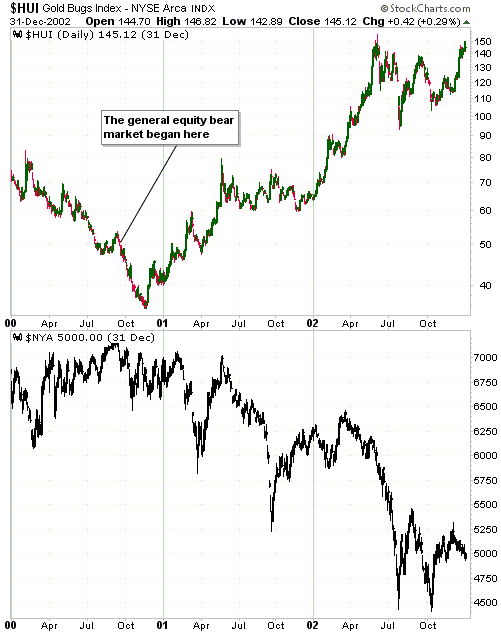
The second case involves the general equity bear market that began in September of 2000 and continued until early-2003. This bear market also resulted in peak-to-trough losses of around 50% for the senior US stock indices.

The following chart comparison of the HUI and the NYSE Composite Index (NYA) shows that the gold-mining sector commenced a strong upward trend about 2.5 months after the start of the general equity bear market. Despite the fact that the HUI suffered a substantial percentage decline during this 2.5-month period, it still managed to gain about 200% over the course of the bear market’s first 20 months.

The gold-mining sector is currently a long way from being ‘overbought’ and over-valued. In fact, by some measures it was recently as ‘oversold’ as it ever gets. The historical cases cited above would therefore be relevant if a general equity bear market were to begin in the near future.

On a related matter, the only times when the owners of gold-mining stocks need to fear a general equity bear market are those times when the gold-mining sector has trended upward with the broad stock market during the 6-12 months prior to the start of the general equity bear market. Consequently, in the unlikely event that the current bull market in US equities continues for one more year and gold-mining stocks trend upward during that year, the gold-mining sector will then be vulnerable to the downward pull of a general equity decline.

Print This Post Print This Post
China’s slow-motion economic disaster

December 7, 2014

There is an excellent interview about China in the latest edition of Barrons magazine. The interviewee is Anne Stevenson-Yang, who, having spent the bulk of her professional life in China since first arriving in 1985, is extremely well-informed on the topic. She is fluent in Mandarin and is currently the research director of J Capital, a company that works for foreign investors in China doing fundamental research on local companies and tracking macroeconomic developments. Anyone interested in finding out what’s really going on in China should click the above link and read the full interview, but here are some excerpts:

People are crazy if they believe any government statistics [such as the 7%+ GDP growth figures], which, of course, are largely fabricated. In China, the Heisenberg uncertainty principle of physics holds sway, whereby the mere observation of economic numbers changes their behavior. For a time we started to look at numbers like electric-power production and freight traffic to get a line on actual economic growth because no one believed the gross- domestic-product figures. It didn’t take long for Beijing to figure this out and start doctoring those numbers, too.

I put much stock in estimates by various economists, including some at the Conference Board, that actual Chinese GDP is probably a third lower than is officially reported. And as for the recent International Monetary Fund report calling China the world’s biggest economy on a purchasing-power-parity basis, how silly was that? China is a cheap place to live if one is willing to eat rice, cabbage, and pork, but it’s expensive as all get out once you factor in the cost of decent housing, a car, and health care.

I’d be shocked if China is currently growing at a rate above, say, 4%, and any growth at all is coming from financial services, which ultimately depend on sustained growth in the rest of the economy. Think about it: Property sales are in decline, steel production is falling, commercial long-and short-haul vehicle sales are continuing to implode, and much of the growth in GDP is coming from huge rises in inventories across the economy. We track the 400 Chinese consumer companies listed on the Shanghai and Shenzhen stock markets, and in the third quarter, their gross revenues fell 4% from a year ago. This is hardly a vibrant economy.

And:

The giant government economic-stimulus programs since 2008 are rapidly losing their effectiveness. The reason is simple. Much of the money has been squandered in money-losing industrial projects and vanity infrastructure spending that make no economic sense beyond supplying temporary bump-ups in GDP growth. China is riding an involuntary credit treadmill where much new money has to be hosed into the economy just to sustain ever-mounting bad-debt totals. Capital efficiency, or the amount of capital it takes to generate a unit of GDP growth, has soared as a result.

And:

The Chinese home real estate market, mostly units in high-rise buildings, is truly bizarre. Many Chinese regard apartments as capital-gains machines rather than sources of shelter. In fact, there are 50 million units in China that are owned but vacant. The owners won’t rent them because used apartments suffer an immediate haircut in value.

It’s as if the government created a new asset class that no one lives in. This fact gives lie to the commonly held myth that the buildout of all these empty towers and ghost cities is a Chinese urbanization play. The only city folk who don’t own housing are the millions of migrant laborers continuously flocking to Chinese cities. Yet, they can’t afford the new housing.

And:

All of China’s major corporations are speculating on residential real estate with either cash reserves or borrowed money. Who wants to build, say, a shipbuilding plant when a company thinks it can make a lot more speculating in the housing market?

And:

…liquidity seems to be a growing problem in China. Chinese corporations have taken on $1.5 trillion in foreign debt in the past year or so, where previously they had none. A lot of it is short term. If defaults start to cascade through the economy, it will be more difficult for China to hide its debt problems now that foreign investors are involved. It’s here that a credit crisis could start.

And:

As for Xi’s much-ballyhooed anticorruption campaign inside China, it offends me that international media depict it as a good-governance effort. What’s really going on is an old-style party purge reminiscent of the 1950s and 1960s with quota-driven arrests, summary trials, mysterious disappearances, and suicides, which has already entrapped, by our calculations, 100,000 party operatives and others. The intent is not moral purification by the Xi administration but instead the elimination of political enemies and other claimants to the economy’s spoils.

China is an economic disaster happening in slow motion, but it is not a good idea to be short the country’s stock market.

Print This Post Print This Post
The “great depression” of 1873-1896

December 5, 2014

Since coming into existence in 1913, the Federal Reserve has helped facilitate a massive decline in the purchasing power of the US dollar. However, the Fed is not the root of the US monetary problem, as evidenced by the fact that there were several US financial crises/panics during the half-century prior to the establishment of the Fed. As explained by Murray Rothbard (America’s greatest economics historian), these pre-Fed financial panics “were a result of the arbitrary credit creation powers of the banking system.” In other words, the root of the problem is — and has always been — the legal ability of banks to create credit ‘out of thin air’, commonly referred to as fractional reserve banking. With or without a central bank, fractional reserve banking will tend to bring about a boom/bust cycle and thus reduce the long-term rate of economic progress.

Central banking is perhaps history’s best example of government attempting to fix a problem — in this case, the instability resulting from the practice of fractional reserve banking — and making things much worse in the process. The fact that fractional reserve banking leads to periodic crises suggests the following solution: banks should not be allowed to create new money out of nothing, that is, banks should be subject to the same laws as everyone else. However, the big banks tend to be politically influential, and imposing proper restrictions on the banking industry’s ability to expand its collective balance sheet would also restrict the government’s ability to grow, so rather than address the underlying problem the government put in place a system that would enable arbitrary credit creation to continue for much longer and to a much greater extreme without a ‘cleansing’ crisis. In the US, this “system” is called the Federal Reserve. Since the advent of the Federal Reserve there have been longer periods of apparent stability followed by much greater financial crises and economic downturns (the three most severe peace-time economic downturns in the US (the downturns of the 1930s, the 1970s and the 2000s) occurred since the birth of the Fed). There has also been a dramatic increase in the size of the US federal government, with its adverse consequences for freedom.

So, fractional reserve banking caused financial panics and boom-bust economic cycles in the US prior to the creation of the Fed, but crises and recessions in the pre-Fed era were relatively short and the economy tended to recover far more quickly. How, then, do I explain the “great depression” of 1873-1896, which some commentators cite in an effort to ‘prove’ that the Gold Standard doesn’t work and that central banking can be beneficial? 

The short answer is that there was no “great depression” during 1873-1896. Thanks to excessive deposit creation (fractional reserve banking) there were three financial panics during this period (in 1873, 1884 and 1893), but the overall economy achieved very strong real growth. 

For a longer answer I turn to the following excerpts from Murray Rothbard’s “A History of Money and Banking in the United States”:

“Orthodox economic historians have long complained about the “great depression” that is supposed to have struck the United States in the panic of 1873 and lasted for an unprecedented six years, until 1879. Much of this stagnation is supposed to have been caused by a monetary contraction leading to the resumption of specie payments in 1879. Yet what sort of “depression” is it which saw an extraordinarily large expansion of industry, of railroads, of physical output, of net national product, of real per capita income? As Friedman and Schwartz admit, the decade from 1869 to 1879 saw a 3-percent-perannum increase in money national product, an outstanding real national product growth of 6.8 percent per year in this period, and a phenomenal rise of 4.5 percent per year in real product per capita. Even the alleged “monetary contraction” never took place, the money supply increasing by 2.7 percent per year in this period. From 1873 through 1878, before another spurt of monetary expansion, the total supply of bank money rose from $1.964 billion to $2.221 billion — a rise of 13.1 percent or 2.6 percent per year. In short, a modest but definite rise, and scarcely a contraction.

It should be clear, then, that the “great depression” of the 1870s is merely a myth — a myth brought about by misinterpretation of the fact that prices in general fell sharply during the entire period. Indeed, they fell from the end of the Civil War until 1879.

Friedman and Schwartz estimated that prices in general fell from 1869 to 1879 by 3.8 percent per annum. Unfortunately, most historians and economists are conditioned to believe that steadily and sharply falling prices must result in depression: hence their amazement at the obvious prosperity and economic growth during this era. For they have overlooked the fact that in the natural course of events, when government and the banking system do not increase the money supply very rapidly, freemarket capitalism will result in an increase of production and economic growth so great as to swamp the increase of money supply. Prices will fall, and the consequences will be not depression or stagnation, but prosperity (since costs are falling, too), economic growth, and the spread of the increased living standard to all the consumers.”

…”It might well be that the major effect of the panic of 1873 was not to initiate a great depression, but to cause bankruptcies in overinflated banks and in railroads riding on the tide of vast government subsidy and bank speculation.”

…”The record of 1879-1896 was very similar to the first stage of the alleged great depression from 1873 to 1879. Once again, we had a phenomenal expansion of American industry, production, and real output per head. Real reproducible, tangible wealth per capita rose at the decadal peak in American history in the 1880s, at 3.8 percent per annum. Real net national product rose at the rate of 3.7 percent per year from 1879 to 1897, while per-capita net national product increased by 1.5 percent per year.

Once again, orthodox economic historians are bewildered, for there should have been a great depression since prices fell at a rate of over 1 percent per year in this period. Just as in the previous period, the money supply grew, but not fast enough to overcome the great increases in productivity and the supply of products. The major difference in the two periods is that money supply rose more rapidly from 1879 to 1897, by 6 percent per year, compared with the 2.7 percent per year in the earlier era. As a result, prices fell by less, by over 1 percent per annum as contrasted to 3.8 percent. Total bank money, notes, and deposits rose from $2.45 billion to $6.06 billion in this period, a rise of 10.45 percent per annum — surely enough to satisfy all but the most ardent inflationists.”

“The financial panics throughout the late nineteenth century were a result of the arbitrary credit creation powers of the banking system. While not as harmful as today’s inflation mechanism, it was still a storm in an otherwise fairly healthy economic climate.”

In summary, a 23-year period in which the US economy achieved the strongest real growth in its history is strangely characterised in some quarters as a “great depression”, quite likely because so many economists and historians do not understand that real economic progress puts DOWNWARD pressure on prices. Unfortunately, there is no chance that the next 10 years will be anything like the so-called “great depression” of late 19th Century. We won’t be so lucky.

Print This Post Print This Post
The “gold backwardation” (a.k.a. negative GOFO) storm in a teacup

December 3, 2014

This blog post is a slightly modified excerpt from a recent TSI commentary.

Back in July of last year I pointed out that in a world where official short-term interest rates are close to zero, some short-term market interest rates are also going to be very close to zero, and that, in such cases, interest-rate dips below zero could occur as a result of insignificant price fluctuations. A topical example at the time was “gold backwardation”, meaning the price of gold for immediate delivery moving above the price of gold for future delivery. Gold backwardation is still a topical example and, thanks to the persistence of near-zero official US$ interest rates, is still not significant. What I mean is that the “backwardation” has almost everything to do with the near-zero official short-term interest rate and almost nothing to do with gold supply/demand. So please, gold analysts, stop pretending otherwise!

When the gold market is in backwardation, something called the Gold Forward Offered Rate (GOFO) will be negative. A negative GOFO effectively just means that it costs more for a major bank to borrow gold than to borrow US dollars for a short period. In a situation where the relevant short-term US$ interest rate (LIBOR) is close to zero, why would this be important or in any way strange?

The answer is that it wouldn’t be. What’s strange is an official US$ interest rate pegged near zero. Given this US$ interest rate situation, it is not at all surprising or meaningful that the GOFO periodically dips into negative territory and the gold market slips into “backwardation”.

The charts displayed below illustrate the point I’m attempting to make. The first chart shows the 1-month GOFO and the second chart shows the 1-month LIBOR. Notice that apart from a couple of spikes in one that don’t appear in the other, these charts are essentially identical. The message is that GOFO generally tracks LIBOR, so with the Fed having effectively pegged LIBOR near zero since late-2008 it would be normal for GOFO to fluctuate around zero and to sometimes be negative.

The upshot is that a negative GOFO (and, therefore, a “backwardated” gold market) would be a meaningful signal if LIBOR were at a more normal level (say, 3%), but with LIBOR near zero it should be expected that GOFO will periodically move below zero. In other words, there won’t be a useful signal from GOFO until official US$ interest rates move up to more normal — or at least up to less abnormal — levels.

Before ending this post, here are two related points on gold-linked interest rates:

First, the Gold Lease Rate (GLR) that you see quoted in various places is equal to LIBOR minus GOFO. It is a derived quantity and not the actual amount that is paid to borrow gold. The actual amount that any gold borrower pays in interest will be negotiated on a case-by-case basis with the gold lender and will NEVER be negative. In other words, although the derived GLR will sometimes go into negative territory, this doesn’t mean that people are being paid to borrow gold.

Second, a lower GOFO implies a higher (not lower) cost to borrow gold. GOFO’s recent dip into negative territory therefore implies that the cost to borrow gold has risen, although the percentage changes have been tiny and, as noted above, the lease rate paid by a specific borrower will generally not be the same as the GLR published by the LBMA and charted at web sites such as Kitco.com.

Print This Post Print This Post
Right for the wrong reasons

November 26, 2014

It is not uncommon for people who make predictions about the financial markets to be right for the wrong reasons, meaning that even though their reasoning turned out to be wrong the market ended up doing roughly what was predicted. Here are two examples that explain what I’m talking about.

The first example involves the popular forecast, during 1995-2000, that the US stock market would continue to be propelled upward by a technology-driven productivity miracle. This reasoning was used by high-profile analysts such as Abby Joseph Cohen to explain why stratospheric valuations would go even higher. As long as the bull market remained intact these analysts were generally held in high regard, but their reasoning was terribly flawed.

Anyone with a basic understanding of good economic theory knows that increasing productivity causes prices to fall, not rise. Furthermore, while it is certainly possible for some individual companies to justifiably obtain higher market valuations by becoming more productive than their competitors, a general increase in productivity will not cause a sustained, economy-wide increase in corporate profitability and will not justify higher valuations for most equities. To put it another way, the main beneficiaries of higher productivity are consumers, not stock speculators and investors in equity-index funds. Consequently, there was never a possibility that rising productivity was behind the 1995-2000 surge in the US stock market. “Rising productivity” was just a story that sounded good to the masses while the market was going up.

Like all bull markets in major asset classes, the bull market in US equities that ended in 2000 was driven by the expansions of money and credit. After the pace of monetary expansion slowed, the bull market naturally collapsed.

The second example involves the forecast, in 2011-2012, that the gold price was destined to fall a long way due to deflation. Regardless of whether your preferred definitions of inflation and deflation revolve around money supply, credit supply, asset prices or consumer prices, there has been no deflation and plenty of inflation over the past 2-3 years, so advocates of the “gold is going to lose a lot of value due to deflation” forecast could not have been more wrong in their reasoning. However, the gold market has performed as predicted!

Rather than being a victim of deflation, gold was a victim of the reality that over the past three years a bout of rampant monetary inflation led to a huge rally in the broad stock market, which, in turn, boosted economic confidence. Ironically, had the reasoning of the “gold to fall due to deflation” group been close to the mark, the gold price would probably have experienced nothing more than a 12-18 month consolidation following its September-2011 peak. This is not because gold benefits from deflation (it doesn’t), but because the combination of economic weakness, declining economic confidence and the actions taken by central banks to address the economic weakness would have elevated the investment demand for gold.

I’ve noticed that fundamentals-based analysis is rarely questioned if it matches the price action and, by the same token, is often greeted with skepticism if it is in conflict with a well-established price trend. During a raging bull market even the silliest bullish analyses tend to be viewed as credible, and after a bear market has become ‘long in the tooth’ even a completely illogical or irrelevant piece of analysis will tend to be viewed as smart, or at least worthy of serious consideration, if its conclusion is bearish. However, from a practical investing perspective, fundamental analysis can be most useful when its conclusions are at odds with the current price trend. The reason is that the greatest opportunities for profit in the world of investing and long-term speculation are created by divergences between value and price.

Print This Post Print This Post
Revisiting the Goldman Sachs $1050/oz gold forecast

November 24, 2014

This blog post is a slightly-modified excerpt from a recent TSI commentary.

At the beginning of this year, banking behemoth Goldman Sachs (GS) called for gold to end the year at around $1050/oz. I didn’t agree with this forecast at the time and still believe it to be an unlikely outcome (although less unlikely than it was a few months ago), but earlier this year I gave Goldman Sachs credit for at least looking in the right direction for clues as to what would happen to the gold price. In this respect the GS analysis was/is vastly superior to the analysis coming from many gold-bullish commentators.

Here’s what I wrote at TSI when dealing with this topic back in April:

GS’s analysis is superior to that of many gold bulls because it is focused on a genuine fundamental driver. While many gold-bullish analysts kid themselves that they can measure changes in demand and predict prices by adding up trading volumes and comparing one volume (e.g. the amount of gold being imported by China) to another volume (e.g. the amount of gold being sold by the mining industry), the GS analysts are considering the likely future performance of the US economy.

The GS bearish argument goes like this: Real US economic growth will accelerate over the next few quarters, while interest rates rise and inflation expectations remain low. If this happens, gold’s bear market will continue.

The logic in the above paragraph is flawless. If real US economic growth actually does accelerate over the next few quarters then a bearish view on the US$ gold price will turn out to be correct, almost regardless of what happens elsewhere in the world. The reason the GS outlook is probably going to be wrong is that the premise is wrong. Specifically, the US economy is more likely to be moribund than strong over the next few quarters. It’s a good bet that inflation expectations will remain low throughout this year, but real yields offered by US Treasuries are more likely to decline than rise due to signs of economic weakness and an increase in the popularity of ‘safe havens’ as the stock market trends downward.

I was right and GS was wrong about interest rates, in that both nominal and real US interest rates are lower today than they were in April. However, it is certainly fair to say that GS’s overall outlook as it pertains to the gold market has been closer to the mark than mine over the intervening period. This is primarily because economic confidence has risen, which is largely due to the continuing rise in the senior US stock indices.

So, regardless of whether or not gold ends up getting closer to GS’s $1050/oz target before year-end (I don’t think it will), I give GS credit for being mostly right for mostly the right reasons over the course of this year to date.

For their part, many gold bulls continue to look in the wrong direction for clues as to what the future holds in store. In particular, they continue to fixate on trading volumes, seemingly oblivious to the fact that for every net-buyer there is a net-seller and that the change in price is the only reliable indicator of whether the buyers or the sellers are the more motivated.

Print This Post Print This Post
Something has changed

November 19, 2014

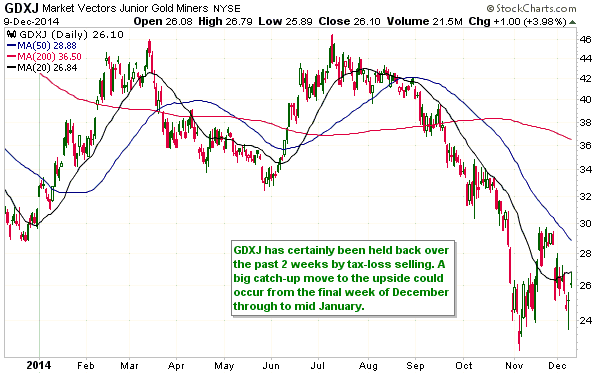
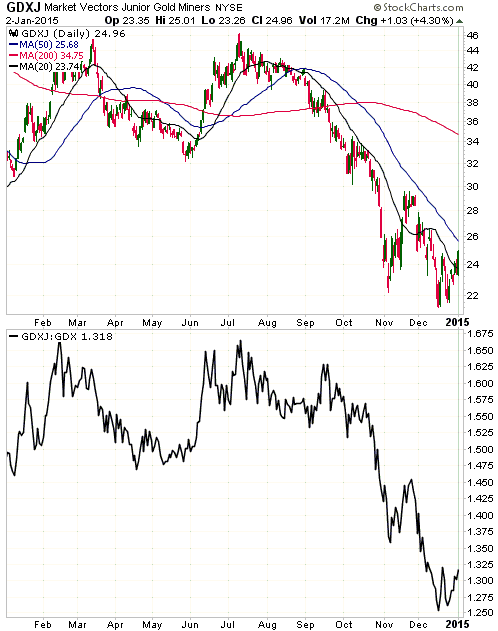
The gold-stock indices and ETFs are getting close to reasonable upside targets for the INITIAL rallies from their October-November crash lows. These targets are defined by resistance at 185-190 for the HUI and 77-80 for the XAU. For GDXJ, the upside target for the initial rally mentioned at TSI was $29, which has already been reached. Actually, the resistance that defines the most realistic initial rally target for GDXJ extends from $29 to $31.50.

The main purpose of this  brief post is to point out that something has just happened that hasn’t happened since the first half of June. I’m referring to the fact that for the first time in more than 5 months, GDXJ has just achieved 3 consecutive up-days.

This is just another small piece of a big puzzle. It is evidence that the current rebound could evolve into something substantial.

GDXJ_181114

Print This Post Print This Post