Sidebar left

Rallying against the Chinese invasion of Australia

June 3, 2015

According to the fellow in the video shown below, the Chinese are invading Australia. It isn’t a military invasion, it’s an economic invasion that involves the buying-up of Australian real estate and has caused young Australian families to be priced out of the property market. The solution, apparently, is for the Australian federal government to stop turning a blind eye to this flood of foreign investment and, instead, to put a stop to it, thus resuscitating the “Australian dream”. Unfortunately, the star of the video is both ethically and economically wrong. He is ethically wrong because he is advocating the widespread violation of property rights (he wants the government to dictate who Australian property owners can sell to, with the particular aim of preventing the sale of property to buyers who live in China), but it’s the economic error I’m going to deal with in this post.

Our ‘the-government-oughta-do-something-to-stop-the-Chinese-real-estate-invasion’ protest organiser and You-Tuber is unaware of two important economic realities, the first and lesser important of which is that Australia runs a large current-account deficit. This deficit, which comprises dividend payments, interest payments on foreign debt and a surplus of imports over exports, is running at around A$40B per year. This means that about $40B per year is ‘flowing’ out of the country on the current account, which means that about $40B/year of new investment MUST flow into the country (since nobody has any use for Australian dollars outside Australia). In other words, the current account deficit necessitates $40B per year of net foreign investment, approximately a quarter of which goes into real estate.

The more important economic reality of which our irrepressible video presenter is unaware is Australia’s rapid rate of monetary inflation. Thanks to the activities of the Reserve Bank of Australia (RBA) and the commercial banks, the supply of Australian dollars has risen by 13% over the past 12 months and 44% over the past 4 years. With this rate of money-supply growth and low interest rates it is no wonder that houses have become very expensive. With this monetary backdrop, houses would almost certainly have become very expensive even if China didn’t exist. Furthermore, a rapid rate of monetary inflation tends to increase the current account deficit and weaken the currency on the foreign exchange market, thus putting more of the currency in the hands of foreign investors and simultaneously making domestic property prices look cheaper to foreign investors.

So, if the guy in above video had a better understanding of economics he’d be organising a protest outside the RBA headquarters instead of the Chinese consulate.

Print This Post Print This Post
The ‘great’ gold debate

June 1, 2015

The title of this post refers to the debate between Jeff Clark and Harry Dent about gold’s prospects over the next 2 years, with Harry Dent arguing for a collapse in the gold price to less than $700/oz and Jeff Clark arguing in favour of a bullish outcome. I put inverted commas around the word great, because neither participant in this debate made a good argument. However, while the Clark side of the debate could have been a lot better, the Dent side was a stream of complete nonsense. In this post I’ll deal with a couple of the flaws in Dent’s analysis and also briefly address the extremely persistent deflation fantasy that lies at the core of Dent’s latest big prediction*.

An important point to understand is that gold is not now, and has never been, a play on “CPI inflation”. As I stated in an earlier post: “Gold is a play on the economic weakness caused by bad policy and on declining confidence in the banking establishment (led by the Fed in the US). That’s why cyclical gold bull markets are invariably born of banking/financial crisis and/or recession, and why a cyclical gold bull market is more likely to begin amidst rising deflation fear than rising inflation fear.” Jeff Clark barely touches on this key point, while Harry Dent believes that the point is invalidated by the fact that the gold price fell by 33% during part of the 2008 financial crisis.

Harry Dent keeps returning to gold’s performance during 2008 and provides no other historical examples of gold performing poorly in times of financial crisis. He therefore either has very little knowledge of gold’s historical record or he believes that hundreds of years of history were negated by what happened during 2008. Either way, he is misinformed, because gold outperformed the US$ over the course of 2008. The 33% decline is from the best level of the year to the worst level of the year, but even this sizeable peak-to-trough loss was fully eradicated by the first quarter of 2009. Moreover, if we consider the entire Global Financial Crisis (GFC), with the 10th October 2007 closing high for the S&P500 marking its beginning and the 10th March 2009 closing low for the S&P500 marking its end, we find that gold gained 24% in US$ terms and 34% in euro terms over the course of the crisis.

Information that must always be taken into account when assessing gold’s performance in reaction to events is the gold-price starting point. The reason that gold was initially hit hard in US$ terms during the general market crash of 2008-2009 is largely due to the US$ gold price being ‘overbought’ and at a multi-decade high just prior to the crash, which is obviously not the case today. Furthermore, as I mentioned above it quickly recouped its losses.

And information that must be taken into account when assessing the performances of all the financial markets during the GFC of 2007-2009 is that the Fed did not begin to pump-up the US money supply (properly measured via TMS) until September of 2008. From September of 2007 through to August of 2008 the Fed cut interest rates, but the monetary inflation rate remained at a low level. Since there is no longer any scope to cut interest rates, it’s a virtual certainty that the Fed’s initial response to a deflation scare in the not-too-distant future would involve ramping-up the money pumps.

In addition to presenting gold’s GFC performance in a misleading way, there are numerous problems with Dent’s argument. Due to time constraints I’m only going to deal with one of them. Here’s the relevant excerpt:

The gold bug camp is constantly telling us that governments are debasing our currency, especially the almighty US dollar and destroying the value so that the dollar is not a good store of value. I 100% disagree.

Here’s an analogy to explain: Since its invention in 1971, the microchip has been multiplied by the trillions, creating a revolution in human communications. Its evolution is a crystal-clear sign of progress and of a higher standard of living. Translating that back to the dollar argument, if the exponential multiplication of the microchip was (is) a good thing, why would the multiplication of dollars not also be a sign of progress that similarly fosters a revolution in urbanization, more complex and rich specialization of skills, and an improved standard of living? Increasing urbanization leads to rising affluence and the need for greater dollars for transactions in a more complex urban society!

This may be the stupidest economics-related comment I’ve ever read from a trained economist, which is saying something considering the competition. It implies that he doesn’t know the difference between a rise in the quantity of the medium of exchange and a rise in the quantity of real wealth. It implies that he sees no difference between the private sector increasing the supply of labour-saving or life-sustaining or life-enhancing products and central banks creating new money out of nothing. Also, he apparently perceives the factual decline in the US dollar’s purchasing power as a goldbug delusion.

Harry Dent should not be taken seriously, but the view that deflation is coming should not be dismissed out of hand. Also, it is possible to make a legitimate gold-bearish argument, it’s just that Harry Dent hasn’t done it.

Under the current monetary system and the theories that dominate central banking, true deflation — such as occurred in the US during 1930-1932 — has a near-zero probability of happening. In the future there could (almost certainly will) be changes to the monetary system and/or the political environment that pave the way for true deflation, but that’s not something that has a realistic chance of happening over the next two years. In the meantime, there will probably be another deflation scare.

While it’s in progress a deflation scare will look and feel like 1930s-style deflation to most people. The difference is that you don’t get the economic ‘reset’ that would be caused by true deflation. Instead, policy-makers react to the scare by 1) aggressively injecting new money into the economy, 2) ensuring that the total volume of credit continues to grow, and 3) generally doing whatever it takes to prop-up prices. In doing so they add new imbalances to the existing imbalances.

Deflation scares are very bullish for gold. That’s why the deflation scare of 2001-2002 set in motion a large multi-year advance in the gold price and why the deflation scare of 2007-2009 set in motion a large multi-year advance in the gold price. If another deflation scare gets underway this year then so, in all likelihood, will another large multi-year advance in the gold price.

Looking out over the coming 1-2 years, the risk for gold isn’t that there will be true deflation, because that’s a virtual impossibility under the current monetary set-up. Nor is the realistic possibility of a deflation scare a risk for gold, since such a development would create a very gold-bullish fundamental backdrop. Rather, the risk for gold is a continuation of the monetary-inflation-fueled boom of the past few years.

In effect, the main risk for gold is an economic outcome that is almost the OPPOSITE of what Harry Dent is predicting.

*Harry Dent’s modus operandi is to come out with a new ‘big prediction’ almost every year. This creates a media buzz that facilitates the sale of books. If a big prediction doesn’t pan out, no problem — just make another one. Eventually, one will hit the mark. In the early-1990s he got lucky and correctly predicted the ensuing boom (it was blind luck because his reasoning was wrong). If he gets lucky again, he’ll have a track record to shout from the hilltops.

Print This Post Print This Post
The gold-backed Yuan fantasy

May 29, 2015

Assuming that useful price clues are what you want, it’s pointless to analyse the flow of gold into China and within China. I explained why HERE, HERE and HERE. I’ll write about the bogus ‘China gold demand’ theory again in the future as it’s one of the most persistent false beliefs within the bullish camp, but in this post I’m going to quickly deal with another China-related false belief that periodically shifts to the centre of the bullish stage: the idea that China’s government is preparing to back the Yuan with gold.

I was going to write in detail about why a gold-backed Yuan is a pipe dream, but then I discovered Geoffrey Pike’s article on the same topic and realised that doing so would be akin to reinventing the wheel. This is because the aforelinked article encapsulates the argument I would have attempted to make. You should click on the link and read the entire piece (it isn’t long), but here’s the conclusion:

There is no way that the Chinese central planners are going to voluntarily give up an enormous amount of power by going to some form of a gold standard. It would drastically reduce their ability to spend money. It would reduce their power. It would limit their ability (or lack of) to centrally plan the economy.

Given that there are good reasons to expect gold to resume its long-term bull market in the not-too-distant future, why do so many bullish gold analysts argue their cases using the equivalent of fairy stories?

Print This Post Print This Post
More on BitGold, the company with a great new product and an over-hyped stock

May 26, 2015

During the week since I first wrote about BitGold (XAU.V) the stock price has been on a wild ride. It went from C$4.14 up to C$8.00, down to C$4.50, up to C$6.50, and ended the 25th May trading session at C$5.60. At C$5.60/share and with a new (post-acquisition) share count of around 50M, the company has a market cap of roughly C$280M (US$230M). The product appears to be excellent from the perspective of customers, but is the business really worth US$230M?

Let me ask the above question in a different way. With its current fee structure and likely user base it’s possible that BitGold will never be consistently profitable and cash-flow positive. If a business does not have a good chance of ever being consistently profitable or cash-flow positive, what’s it worth?

As a standalone enterprise it is worth very little, especially considering that the company in question could run into regulatory problems after it puts its debit card into operation (this is the point at which governments will start taking a keener interest). However, it could be worth a lot to another company if the money-losing business is complementary to the acquirer’s existing business. For example, companies such as Google and Facebook have paid huge sums (billions of dollars) for businesses that would likely never be consistently profitable as standalone enterprises. They’ve done so because of the value that these businesses would potentially add to the existing Google and Facebook operations.

In any case, I doubt that anyone who has bought BitGold shares at prices above C$4 has done a realistic calculation of the business’s value as either a standalone enterprise or as an add-on to a larger financial services company. Actually, very few of the buyers would have done any calculation of value whatsoever. Instead, they would have bought because they like the idea of BitGold, oblivious to the fact that a good business can be a bad investment at the wrong price, or because they think that someone else will be dumb enough to pay an even higher price in the future.

Moving on, I’m impressed by the company’s senior managers. They did a terrific job of setting up an electronic gold-trading/payment platform, because the system, although simple from a customer’s perspective, is complex. In addition, they have done a fine job to date of whipping up enthusiasm for the stock and they demonstrated financial acumen by using the over-valued shares to make a big acquisition.

The big acquisition I’m referring to is the purchase of GoldMoney.com (GM), a company founded by James Turk, for about C$50M in XAU shares. GM was originally designed to do what BitGold is now planning to do, although it has since turned into a precious-metals dealing and storage service (it provides a cost-effective way for people to buy, hold and sell gold and other PMs without the hassle of taking delivery).

The first press release announcing the acquisition of GM was issued prior to the start of North American trading last Friday and was very misleading. Almost no financial details of the GM business were provided and the information that was provided created a false impression. Canada’s stock-market regulators obviously picked up on this, as the company’s plan to have its shares re-open for trading last Friday morning (the stock had been halted pending the news) had to be abandoned while it put together a new press release containing more details of what it was buying. This second attempt also appears to have been deemed unacceptable by the regulators, however, so the stock remained halted and a third press release announcing the GM acquisition was put out on Monday morning. The third time was the charm and the stock resumed trading around mid-day on Monday 25th May.

The financial details provided in the final press release revealed that GM’s business was shrinking at a rapid pace, that GM had generated only $5M of cash flow in its best year (2011), and that it was cash-flow negative over the past two years.

It’s unlikely that GM’s 135,000 current users will be significantly more profitable as part of BitGold than they were as part of GM.

I’m yet to read a proper valuation analysis (one that uses realistic assumptions) that demonstrates why BitGold deserves a multi-hundred-million-dollar market cap. Actually, I’m yet to read any proper valuation analysis from the bulls. According to the bullish articles I’ve read, you should simply buy the stock because the product is a great idea and the company’s founder is very smart. It’s as if there is no limit to what you should pay for an investment as long as there is a good story behind it. The bulls on the stock also point out that some big-name investors have taken significant BitGold positions. This is true, but the big-name investors generally paid C$0.90/share or less for their stakes. I could be wrong, but I doubt that they are interested in buying near the current price.

I don’t want it to seem as if I’m on some sort of crusade against BitGold. I very much want the business to succeed, because I like the product and want it to remain available. My only issue is with the stock’s valuation.

Even if the product makes great strides in popularity, with its current fee structure the underlying company will always be a low-margin business and therefore deserving of a low valuation. This, of course, doesn’t guarantee that the stock’s valuation won’t go a lot higher than its current elevated level, given the public’s proven ability to ignore valuation for long periods. There is also a chance that if BitGold can grow its customer base into the millions then it will be worth a lot to another electronic payment company such as PayPal or Mastercard, even if the BitGold business is a consistent money-loser. That’s one reason I definitely wouldn’t want to be short the stock and why, in terms of practical stock-market speculation (my primary source of income), I have no desire to get involved. Instead, I’ll continue to watch from the sidelines with detached amusement.

Summing up, my concern is that at some unknowable future time the “it’s a great product with smart management therefore the stock should be bought at any price” bubble of enthusiasm will collide with the “it will always be a low-margin business and therefore deserves a low valuation” brick wall of reality.

Print This Post Print This Post
The commodity bear is probably dead

May 25, 2015

Although the evidence is far from conclusive, when taken together a number of price-related developments since the beginning of this year suggest that the cyclical commodity bear market has ended. I’m are referring to the extent to which prices fell during the second half of last year (the decline has the look of a final, bear-market-ending capitulation), the fact that oil is trading in line with a pattern that has marked multi-year bottoms in the past, the upward reversal in the Canadian Dollar, the turn from relative weakness to relative strength in emerging-market equities, and the strong rebounds in Russia’s stock market and currency. I’ll now zoom in on the last two of these developments.

The first of the following weekly charts compares the EEM/SPY ratio (the Emerging Markets ETF relative to the S&P500) with the CRB Index (an index comprising the prices of 17 commodities). The blue line on the top section of the chart is EEM/SPY’s 70-week MA. The EEM/SPY ratio trends in the same direction as the CRB Index and generally leads the CRB Index at major turning points, with trend reversals confirmed by EEM/SPY breaking above/below its 70-week MA.

The EEM/SPY ratio has turned upward. It hasn’t yet broken above its 70-week MA, but the reasons to expect that a reversal will be confirmed within the next few months are the extremely depressed level from which the CRB Index is rebounding and the second of the following charts.

The second chart compares the RSX/EEM ratio (Russian equities relative to Emerging-Market equities) with the CRB Index. When commodity prices are in an upward trend, Emerging-Market equities are generally strong relative to US equities and Russian equities are generally strong relative to Emerging-Market equities. In other words, Russian equities (in US$ terms) tend to be very strong on a relative basis. It works this way almost regardless of what’s happening in Russia.

The RSX/EEM ratio just had its strongest rally in more than 4 years and the rally happened in parallel with widespread pessimism about Russia’s economic prospects. This is a sign that the commodity bear market is over.

EEM_SPY_250515

RSX_EEM_250515

Print This Post Print This Post
Comparing the rates of money-pumping

May 22, 2015

This post is a modified excerpt from a recent TSI commentary.

The following table shows the amount of monetary inflation in a number of different countries/regions. Specifically, the table shows the amount by which the money supplies of Australia, China, the Euro-Zone (EZ), Hong Kong, Japan, the UK and the US have grown over the past year, the past 2 years and the past 4 years. In those cases where it was easy for me to do the calculation I’ve used TMS (True Money Supply) as the monetary aggregate, but in other cases I’ve used M1 or M2. In China’s case I show results for both M1 and M2, because due to the lack of detail provided by the People’s Bank of China I’m not sure which of these measures is closest to TMS.

Country / Region Money Supply Aggregate 1-Year % Growth 2-Year % Growth 4-Year % Growth
Australia TMS 13.2 26.9 44.4
China M1 2.9 8.4 26.7
China M2 9.9 23.1 68.2
Euro-Zone TMS 12.2 18.4 30.6
Hong Kong M2 8.3 22.2 54.1
Japan M2 3.6 7.1 13.4
UK TMS 5.2 11.6 22.3
US TMS 7.7 16.2 47.2

Here’s some information that can be gleaned from the above table:

1) Japan continues to have a relatively slow rate of monetary inflation, despite popular opinion to the contrary. In particular, although it has now been 2 years since the BOJ began to implement the greatest QE program in world history, over the past 2 years Japan’s money supply has only increased by 7.1%. This compares to 2-year increases of 16.4% for the US, 18.2% for Europe and 26.9% for Australia. How much longer will the general perception of what’s happening in Japan diverge from the reality of what’s happening in Japan?

2) The rate of monetary inflation in the EZ is accelerating relative to the rates of monetary inflation elsewhere. That’s why the table reveals that the 12-month rate of inflation in the EZ is now second-only to that of Australia. Furthermore, if the table showed growth figures for the past 6 months it would reveal that the EZ is now leading by a wide margin in the race to inflate (a.k.a. the race to the bottom).

3) Although its M2 money supply is still growing at close to 10%/year, there has been a significant tightening of China’s monetary conditions over the past 18 months. This is — at least in part — both a cause and an effect of the deflation of the country’s property bubble. It seems that in a command economy where non-performing loans never have to be recognised as such, it is possible for a massive credit-fueled investment bubble to deflate gradually.

4) The supply of Hong Kong dollars has increased by 54% over the past 4 years. This monetary inflation and the mimicking of US interest-rate policy, both of which are required to maintain the HK$-US$ peg, explain Hong Kong’s real estate bubble and high cost of living. The HK$-US$ peg hasn’t made sense for a long time and has become the main cause of a huge inflation problem in Hong Kong.

5) Considering the relatively fast pace of Australia’s money-supply growth and the A$’s resulting over-valuation, it’s remarkable that the A$’s exchange rate stayed so high for so long. The reason it didn’t buckle sooner is that the commodity price trend tends to overwhelm all other influences on the A$’s trend. This is illustrated by the following chart of the A$ and the Continuous Commodity Index Fund (GCC). An implication is that almost regardless of its inflation rate, the A$ will turn higher at around the same time as the general commodity price trend turns higher, which, by the way, probably just happened or will happen within the next few months.

A$_GCC_210515

Print This Post Print This Post
BitGold: Great product, over-priced stock

May 19, 2015

A popular view is that gold has no monetary role to play in a modern, technologically-advanced economy. This view is wrong in many ways, including that, thanks to technological advances, gold is now better suited to being money than it has ever been. This is because technology has eliminated the inconveniences that would otherwise limit gold’s usefulness as money, with BitGold being the latest evidence.

In a TSI commentary back in 2010, here’s how I summarised the reason that gold is better suited to being money today than it ever has been in the past: “[The key is that] technology [now] allows gold ownership to simply and instantly be transferred without the need to physically move bullion. Almost all the monetary gold could remain locked in vaults, with ownership to a quantity of gold — anywhere from a tiny fraction of a gram to many kilograms, depending on what is being purchased — being effected electronically.” Previous attempts have been made to create platforms that enable gold to be a convenient medium of exchange, with ownership instantly transferred electronically when a transaction is done, but BitGold is the first attempt that stands a good chance of being successful.

The choice of the name “BitGold” was obviously influenced by the growing popularity (and notoriety) of Bitcoin, but BitGold and Bitcoin have almost nothing in common aside from being ways to store purchasing power and make electronic payments outside the banking system. Importantly, BitGold doesn’t have Bitcoin’s flaws, the most serious of which is that a Bitcoin, like a dollar or a Yen or a Ruble, has no use outside of its role as a medium of exchange.

Rather than being an electronic medium of exchange itself, BitGold is a platform for trading a substance (gold) that has historically been the world’s premier medium of exchange. Putting it another way, users of the BitGold system are not trading computer ‘bits’, they are trading ownership to specific pieces of physical gold stored in a vault.

To be fair, Bitcoin has one significant advantage over BitGold. The beauty of Bitcoin is total decentralisation. There are no intermediaries. There is also no need to jump through the personal ID (Know Your Customer) hoops established by the banking system at the behest of government. With BitGold there are intermediaries (vaults and insurance companies), and all the usual banking-system requirements apply.

As far as I can tell, there is no way to use technology to quickly/efficiently transfer ownership of gold without using intermediaries responsible for storing the gold and keeping it safe. On the plus side, with BitGold the storage is outside the banking system and there are several options regarding geographical location.

I’m not going to explain all the benefits of BitGold and how it works, because that’s already been done in a number of places on the internet. For example, Bob Moriarty provides a good overview HERE. I like BitGold, the product, a lot, and will probably open an account in a couple of months if it operates smoothly during the intervening period. But BitGold, the stock, is a different kettle of fish.

BitGold shares (TSXV: XAU) listed at the same time as the company opened its virtual doors to customers. This is strange. Normally, a company will have operating history before it lists on a stock exchange. Was it a deliberate ploy to float the company on the stock market before there were any hard data that could be used to value the shares? If so it worked, because the shares immediately attained what appears to be a very high valuation. I say “appears to be” in the previous sentence because, with no operating history to go by, it is impossible to even guesstimate what the company is worth. What I can do, however, is roughly determine the amount of success built into the current stock price.

At last Friday’s closing price of C$4.14 and with around 37M shares outstanding, XAU’s market cap is C$153M. This equates to US$126M at the current exchange rate. How many users would BitGold need to justify this market cap?

BitGold makes money on transaction volume — on the purchase/sale of gold. Specifically, it takes 1% of every purchase and every sale of gold made through the BitGold system. Users of the BitGold system are not charged anything for gold storage and insurance, meaning that all costs of running the system must come out of the aforementioned 1% and that whatever is left becomes BitGold’s gross profit. For the purposes of this exercise I’m going to ignore these costs and make the assumption that due to its strong growth potential the company is worth 10-times its annual sales revenue. Based on this assumption, the current market cap of US$126M would be justified by annual sales of roughly US$13M. To get $13M of sales, BitGold would need annual transaction volume of US$1.3B.

Now, the company guesses that its average annual transaction volume per user will be $1000-$2000. If I divide this range into the $1.3B implied by the current market cap, I get a range of 650K-1.3M. In other words, this method of valuation suggests that the current share price is discounting a customer base in the 650K-1.3M range.

As an aside, it is clear that BitGold will need a fairly high average transaction volume per user to be meaningfully profitable. However, it’s a good bet that many of the users will initially be ‘goldbugs’ who will use the service to make long-term investments in physical gold. Based on its current fee structure, BitGold would be more likely to lose money than make money from this type of customer.

Taking another valuation approach, BitGold has been likened to PayPal so perhaps it would make sense to compare BitGold’s valuation to PayPal’s valuation. PayPal is apparently being valued at $84 per user, but there are three reasons — not even taking into account the fact that PayPal is a major success while BitGold’s success is not yet assured — that BitGold’s valuation should be significantly lower than PayPal’s. The first is that PayPal has no storage and inventory costs to absorb. The second is that PayPal is solely a vehicle for transferring a medium of exchange whereas many of BitGold’s customers will use the service for store-of-value purposes*. The third is that the BitGold service is not available to US citizens. I’ll therefore assume that BitGold’s per-user value is a little lower than PayPal’s.

Assuming $70/user, BitGold’s current market cap implies a user base of 1.8M.

Based on the valuation methods outlined above and the company’s own growth projections, it seems to me that if all goes well then BitGold could grow into its CURRENT market cap in 2-3 years. This means that great success has already been priced in, leaving plenty of risk and no valuation-related upside for new buyers of the shares. Of course, there will always be upside potential due to the pool of greater fools, especially considering that the supply of XAU shares is small at this time.

The bottom line is that BitGold, to me, is like Amazon.com: I love the product, but hate the stock’s current valuation.

*Gresham’s Law is an obstacle to BitGold’s profitability, in that the sort of people who would want to own physical gold would be more likely to spend their fiat currency than their gold. That is, they would tend to hoard their gold and spend their dollars, euros, etc., thus reducing BitGold’s revenue per user.

Print This Post Print This Post
The gold sector: close, but no cigar…yet

May 15, 2015

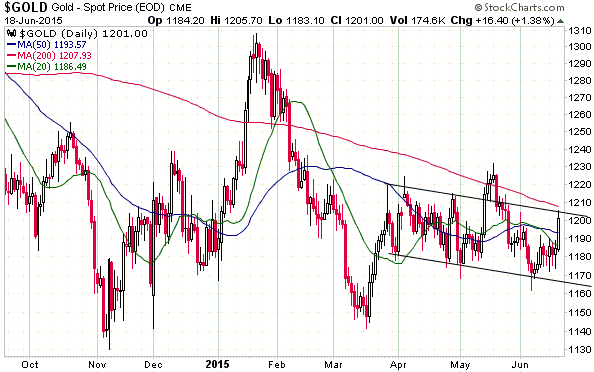
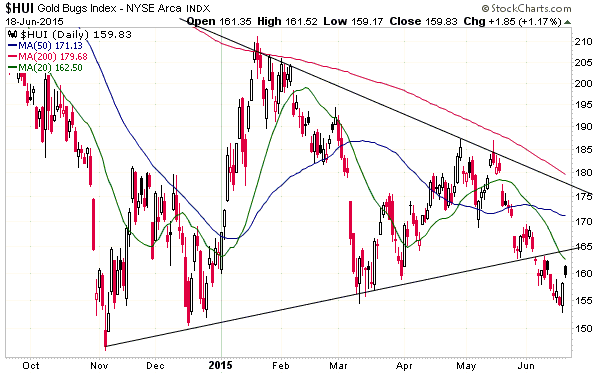
Gold bullion and the Gold BUGS Index (HUI) are close to breaking out to the upside on the daily charts. As shown below, the US$ gold price is butting up against lateral resistance that also now coincides with the 200-day moving average (MA), and the HUI is struggling with resistance defined by a trend-line that dates back to the August-2014 short-term top. Are they going to break out and what will it mean if they do?

gold_140515

HUI_140515

While I expect that gold bullion and the HUI will rise to much higher levels during the second half of this year, I don’t have a strong opinion on whether they will break above their nearby resistance levels within the next few weeks. If I had to make a guess I’d say that they will break out within the next few trading days, but this is not something I’m betting on. In any case, if breaks above these resistance levels occur in the near future it won’t mean much. In particular, multi-week tops could follow closely on the heels of upside breakouts.

The reason that breaks above the aforementioned resistance levels won’t mean much is that the resistance levels, themselves, aren’t important. For one, gold’s resistance at $1220 is primarily defined by a few minor spike-highs over only the past two months (the 200-day MA is not usually a significant resistance level for gold). For another, angled lines drawn on charts, such as the lines drawn on the HUI chart displayed above, are always subjective interpretations and somewhat arbitrary.

By the way, GDX and the XAU have already broken above similar lines to the line drawn on the above HUI chart. Here’s an XAU chart showing the breakout. In the grand scheme of things, this breakout doesn’t matter.

XAU_140515

The point I want to make is although breaks above the price-related obstacles that are currently being challenged won’t give us useful new information, it won’t take much additional strength from here to effect upside breakouts that really do mean something. For example, in terms of confirming a major turn to the upside the HUI resistance that matters is in the low-200s, or only about 10% above Thursday’s high.

Print This Post Print This Post
ASS Economics

May 12, 2015

To the Keynesian economist, the world of economics is a sequence of random events — an endless stream of anecdotes. Things don’t happen for any rhyme or reason, they just happen. And when they happen the economist’s first job is to come up with an explanation by looking at the news of the day, because there will always be current events that can be blamed for any positive or negative developments.

It’s futile to look any deeper, for example, to consider how policies such as meddling with interest rates might have influenced investment decisions, because, even though the real-world economy involves millions of individuals making decisions for a myriad of reasons, the individual actors within the economy supposedly form an amorphous mass that shifts about for unfathomable reasons. In fact, in the Keynesian world the economy can be likened to a giant bathtub that periodically fills up and empties out for reasons that can’t possibly be understood, although if an explanation that goes beyond the news of the day is needed the economist can always fall back on “aggregate demand” or its more emotional cousin — “animal spirits”. Specifically, a slowing economy can be said to be the result of falling “aggregate demand”, and when the pace of economic activity is rapid it can be said to be the result of surging “animal spirits”. There’s no need to try to explain the changes in these mysterious entities, because they are inexplicable. They just happen.

Having explained what’s happening to the economy by pointing at seemingly random/unpredictable events or citing unfathomable changes in “aggregate demand”, the economist’s second job is to recommend a course of action. And since the economy can supposedly be likened to a bathtub filled with an amorphous liquid, the level of which periodically rises and falls, it’s up to the economist to suggest ways that add liquid when the level is too low and drain liquid when the level is too high.

Fortunately, adding and draining liquid is very easy to do. For example, to add liquid all that has to be done is for the government to increase its spending and/or for the central bank to create some money out of nothing. It doesn’t matter that the government’s spending is unproductive and that the central bank’s money-pumping falsifies the price signals upon which the market relies; it only matters that more liquid is added to the bathtub.

This approach to economics might seem ad-hoc. It might seem superficial. And it might seem short-sighted. That’s because it is all of these things, which is why Keynesian Economics should be re-branded ASS (Ad-hoc, Superficial and Shortsighted) Economics.

Print This Post Print This Post

The futures price is not a price prediction

May 11, 2015

The price of a commodity futures contract is not the market’s forecast of what the spot price will be in the future. For example, the fact that at the time of writing the price of the December-2016 WTI Crude Oil futures contract is $64.44 does not imply that ‘the market’ expects the price of oil to rise from around $59 (the current spot price) to around $64 by the end of next year. Moreover, the true message of the difference between the futures price and the spot (cash) price can be the opposite of the superficial message, in that the lower the futures price relative to the spot price the more bullish the price implication. If you understand why this is so then you understand more than former Fed chief and present-day blogger Ben Bernanke about how the commodity futures markets work, which, admittedly, is not saying very much.

Part of the reason that the price of a commodity futures contract is not a prediction of the future price of the commodity is that many of the largest participants in the futures markets do not buy/sell futures contracts based on a forecast of what’s going to happen to the price. Instead, they use the futures market to hedge their exposure in the cash market. For example, when an oil producer sells oil futures it is probably doing so because it wants to lock-in a cash flow, not because it expects the price to go down.

The main reason, however, is that the difference between the futures price and the spot price is driven by arbitrage and, in all commodity markets except the gold market, the extent to which current production is able to satisfy current demand (in the gold market there can never be a supply shortage because almost all of the gold mined in world history is still available to meet current demand). In effect, regardless of what people think the price of the commodity will be in the future, arbitrage trading will prevent the futures price from deviating from the spot price after taking into account the cost of credit (the interest rate) and the cost/availability of storage.

Considering the case of the oil market, I mentioned above that the spot price is currently about $59 and the price for delivery in December-2016 is about $64. This $5 difference does not imply that ‘the market’ expects the price of oil to be $5/barrel higher in December-2016 than it is today; it implies that the cost of storing oil for the next 18 months plus the interest income that would be foregone (or the interest that would have to be paid) equates to about $5/barrel. If not, there would be a risk-free arbitrage profit to be had.

For example, if a large speculator who was very bullish on oil bid-up the price of the December-2016 oil contract from $64 to $70, it would create an opportunity for other traders to lock-in a profit by purchasing physical oil and selling the December-2016 futures with the aim of delivering the oil into the contracts late next year. This trade (selling the December-2016 futures and buying the physical) would continue until the difference between the spot and futures prices had fallen by enough to eliminate the profit potential.

For another example, if a large speculator who was very bearish on oil aggressively short-sold the December-2016 oil contract, driving its price down from $64 to $60, it would create an opportunity for other traders to lock-in a profit by selling physical oil and buying the December-2016 futures with the aim of eventually replacing what they had sold by exercising the futures contracts. Even though in this example the December-2016 futures contract is still $1 above the spot price, there is a profit to be had because the cost of storage plus the time value of money amounts to significantly more than the $1/barrel futures premium.

I also mentioned above that the true message of the difference between the futures price and the spot (cash) price can be the opposite of the superficial message, in that the lower the futures price relative to the spot price the more bullish the price implication. I’ll use the same oil example to explain why.

As I pointed out, if the futures price falls by enough relative to the spot price it will lead to a situation where there is an essentially risk-free arbitrage profit to be made by selling the physical and buying the futures. However, this trade is only possible if the physical market is well supplied. If this isn’t the case and all the oil being produced is needed for current consumption, then the price of oil for future delivery can drop to an unusually low level relative to the spot price and stay there. If the current supply situation is tight enough then the futures price could even drop below the spot price. That’s why a sustained situation involving an unusually-low futures price relative to the spot price has bullish, not bearish, price implications.

My final point is that one of the most important influences on the difference between spot and futures prices for many commodities is the prevailing interest rate. In the gold market it is the most important influence by a country mile. The lower the interest rate the smaller the difference will tend to be between the spot price and the prices for future delivery, so in a world dominated by ZIRP (Zero Interest Rate Policy) the differences between spot and futures prices will generally be smaller than usual.

In conclusion, anyone who views an unusually-large premium in the commodity futures price as bullish and an unusually-low (or negative) premium in the commodity futures price as bearish is looking at the market bass-ackwardly.

Print This Post Print This Post

Large sums of cash are hot potatoes

May 9, 2015

There’s a line of thinking to the effect that Quantitative Easing (QE) is not inflationary because it involves the exchange of one cash-like instrument for another. Taking the case of the US, the Fed’s QE supposedly adds X$ of money to the economy and simultaneously removes X$ of “cash-like” securities, leaving the total quantity of “cash-like” instruments unchanged. However, even putting aside the fact that many of the securities purchased as part the Fed’s QE programs are not remotely “cash-like” (nobody with a modicum of economics knowledge would claim that a Mortgage-Backed Security was cash-like), this line of thinking is patently wrong.

The simplest way for me to explain why it is patently wrong is via a hypothetical example that accurately reflects the situation in the real world. In my example, Jack is a securities dealer who deals directly with the Fed.

As part of a QE program the Fed wants to buy $1B of 2-year T-Notes with newly-created cash. Jack has $1B of T-Notes to sell, so a transaction occurs. If the Fed and Jack had simply swapped securities then there would be nothing inflationary about this transaction. Instead of holding the $1B of T-Notes yielding, say, 0.6%, Jack would be left with $1B of some other income-producing asset. However, what Jack is actually left with is a bank deposit containing 1 billion dollars of money earning 0%. Moreover, whereas he previously had no risk of suffering a nominal loss (assuming that he was prepared to hold the Notes to maturity), he now bears a low-probability risk of suffering a large nominal loss since only a tiny fraction of his $1B deposit is government guaranteed. Consequently, Jack will be quick to spend the money received from the Fed, most likely by purchasing some other bonds or perhaps by purchasing some equities.

Let’s assume that Jack uses half of the money received from the Fed to buy bonds from Bill and the other half to buy bonds from Ted. Bill and Ted are hedge fund managers. Following this transaction, Bill and Ted now each have the ‘problem’ of finding something to do with $500M of cash, because, like Jack, they can’t just leave such a large sum in a zero-interest bank deposit. They therefore quickly turn around and buy other assets, shifting the ‘problem’ of what to do with the cash to the sellers of those assets.

Get the picture? When the Fed injects money via its QE programs it is, in effect, passing a hot potato to securities dealers. The hot potato quickly gets handed off to other dealers and speculators, giving the demand for various financial assets an artificial boost along the way. Eventually the money will leak out of the bank accounts of large-scale speculators and begin to boost prices outside the financial markets, but, as we’ve seen, that process can take a long time.

Print This Post Print This Post

The shrinking central-bank reserve stash

May 5, 2015

The Bloomberg article posted HERE reports that after a decade-long 5-times increase, the worldwide stash of foreign currency reserves held by central banks has begun to shrink. Is this good, bad, or irrelevant?

The answer is no — it’s not good, it’s not bad, and it’s not irrelevant. To be more accurate, it would be good if it indicated a new long-term trend, but it almost certainly doesn’t indicate this. Instead, it is just part and parcel of the way the current monetary system works.

The key to understanding the implications of global reserve changes is knowing that these changes are mostly driven by attempts to manipulate exchange rates.

During the first stage of a two-stage cycle, many central banks and governments perceive that their economies can gain an advantage by weakening their currency on the foreign exchange market. Although it is based on bad theory, this perception is a real-world fact and often guides the actions of policy-makers. It prompts central bankers to buy-up the main international trading currency (the US$) using newly-printed local currency, resulting in the build-up of foreign currency reserves, growth in the local currency supply, and an unsustainable monetary-inflation-fueled boom in the local economy.

The build-up of foreign currency reserves during the first part of the cycle is therefore not a sign of strength; it is a sign of a future “price inflation” problem and a warning that the superficial economic strength is a smokescreen hiding widespread malinvestment.

During the second stage of the cycle the bad effects of creating a flood of new money to purchase foreign currency reserves and manipulate the exchange rate become apparent. These bad effects include economic weakness as investing mistakes become apparent, as well as uncomfortably-rapid “price inflation”. Pretty soon, policy-makers in the ‘reserve-rich’ country find themselves in the position of having to sell reserves in an effort to arrest a downward trend in their currency’s exchange rate — a downward trend that is exacerbating the local “price inflation” problem. This is the situation in which many high-profile “emerging” economies have found themselves over the past two years, with Brazil being one of the best examples.

In other words, the world is now immersed in the stage of the global inflation cycle — a cycle that’s a natural consequence of today’s monetary system — in which reserves get disgorged by central banks as part of efforts to address blatant “inflation” problems. This would be a good thing if it indicated that the right lessons had been learned from past mistakes, leading to a permanent change in strategy. However, that’s almost certainly NOT what it indicates.

The disturbing reality is that at some point — perhaps as soon as this year — a large new injection of money will be seen as the solution, because bad theory still dominates. As evidence, I cite two comments from the above-linked article. The first is by the author of the piece, who implies in the third paragraph that emerging-market countries need to boost their money supplies to shore-up faltering economic growth. The second is from a former International Monetary Fund economist and current hedge-fund manager, who claims via a quote in the fourth paragraph that emerging markets now need more stimulus.

So, emerging-market economies have severe problems that can be traced back to earlier monetary stimulus, but the solution supposedly involves a new bout of monetary stimulus. Let the idiocy continue.

Print This Post Print This Post