Sidebar left

A basic misunderstanding about saving

June 26, 2015

Keith Weiner often posts thought-provoking stuff at his Monetary Metals blog. A recent post entitled “Interest – Inflation = #REF” is certainly thought-provoking, although it is also mostly wrong. It is mostly wrong because it is based on a fundamental misunderstanding about saving.

Before I get to the main point, I’ll take issue with the following paragraph from Keith’s post:

Normally, you don’t spend your savings, only the income on it. In ancient times, people had to hoard a commodity like salt when they worked. In retirement, they sold it to buy food. Modern economies evolved beyond that, with the development of interest. Retirees should not have to liquidate their life savings.

Who says you shouldn’t have to spend your savings? One of the main reasons to save today is so that you can spend more in the future. Also, interest isn’t a modern development, it has been inherent in economic activity since the dawn of economic activity.

Now, the main point: When people save money, it’s not actually money that they want to save. Money is just a medium of exchange. What they want to save is purchasing power (PP). For example, if I have a million dollars of savings to live on over the next 20 years, what matters to me is what the money buys now and what it will probably buy in the future. If a million dollars is currently enough to buy a mansion in the best part of town and if a dollar is likely to maintain its PP over the next 20 years, then I’ll probably be able to live quite comfortably on my savings. However, if a million dollars only buys me a loaf of bread, then I have a problem.

A consequence is that, contrary to the assertion in Keith’s post, the real interest rate is very important to the average retiree. The easiest way to further explain why is via a hypothetical example.

Fred, our hypothetical retiree, has $1M of savings at Year 0. At the dollar’s current purchasing power his cost of living is $20K per year. Also, the interest rate that he receives on his savings is ZERO, but the dollar is gaining PP at the rate of 5% per year.

At Year 1, Fred’s monetary savings will have declined to $980K, because he spent $20K and received no interest. However, $980K now has the same PP that $1029K had a year earlier. That is, over the course of the year Fred’s PP increased by 29K Year 0 dollars. Furthermore, his annual living expense will have declined to $19K.

At Year 2, Fred’s monetary savings will have declined to $961K, because he spent $19K and received no interest. However, $961K now has the same PP that $1059K had at Year 0.

That is, after 2 years of receiving no nominal interest on his savings, our hypothetical retiree is in a significantly stronger financial position. Thanks to the receipt of a positive real interest rate he now has more purchasing power than he started with. The fact that he has less currency units is irrelevant.

I could provide a second hypothetical example of a retiree who, despite earning a superficially-healthy positive nominal interest rate and ending each year with the same or more currency units, has a worsening financial position over time thanks to a negative real interest rate. I could, but I won’t.

The upshot is that the real interest rate is not only important, for savers and investors it is of greater importance than the nominal interest rate. The problem, today, is not only that central banks have pushed the nominal short-term interest rate down to near zero, it’s also that they have done this while reducing the PP of money. The great sucking sound is wealth being siphoned from savers via negative real interest rates.

Print This Post Print This Post
More confusion about gold demand

June 24, 2015

“Nonsensical Gold Commentary” was the title of a recent Mineweb article in which the author, Lawrence Williams, laments that a significant amount of commentary published on gold can be uninformed and misleading. This is ironic, since the bulk of Lawrence Williams’ writings about the gold market (and the silver market) are uninformed and misleading.

When it comes to his gold-market commentary, Mr. William’s most frequent mistake is to focus on the amount of gold ‘flowing’ into China as if this were one of the most important drivers, if not the most important driver, of the gold price. To be fair, in this regard he has a lot of company and much of what he writes on the topic is copied from the wrongheaded analyses put forward by reputed experts on gold.

I’ve dealt with the China gold fallacy in several previous posts*. It is related to the more general fallacy that useful information about gold demand and the gold price can be obtained by monitoring the amount of gold being transferred from one part of the market to another or from one geographical region to another.

Since every gold transaction involves an increase in gold demand on the part of the buyer and an exactly offsetting decrease in gold demand on the part of the seller, it should be obvious that overall demand cannot possibly change as a result of any purchase/sale. And it should be obvious that regardless of whether gold’s price is in a bullish or a bearish trend, some parts of the market and some geographical regions will be net buyers and others will be net sellers. And it should also be obvious that an increase in volume — which requires an increase in both buying and selling — can accompany a price decline or a price advance, meaning that there is nothing strange about a fall in price going hand-in-hand with increased buying or a rise in price going hand-in-hand with increased selling.

Unfortunately, none of these facts are apparent to the gold analysts who attempt to obtain clues about gold’s price performance and prospects by tracking the amount of gold being transferred from sellers to buyers.

I’m reticent to pick on Lawrence Williams, because I suspect that he means well and, as mentioned above, he has a lot of company. However, his commentary is difficult for me to ignore, the reason being that I closely monitor the Mineweb site and therefore can’t avoid seeing the headlines of the articles he writes. For example, when scanning through the Mineweb headlines a few days ago I was enticed to click on an article titled “SGE gold withdrawals surge again“, which turned out to be another Williams piece about China’s gold demand. Although this article regurgitated some of the usual misleading information, the last paragraph was interesting.

The last paragraph was interesting because it contained a blatant contradiction. Here’s the relevant excerpt:

…the overall level of SGE [Shanghai Gold Exchange] withdrawals has to be a consistent indicator of Chinese demand trends and from them it looks as though the trend is rising so far this year whether they are a definitive measure of Chinese wholesale gold consumption or not. They are most certainly a measure of China’s internal gold flows.

The last sentence is correct. The SGE withdrawals are a measure of internal gold flows, that is, a measure of the amount of gold transferred from some people in China to other people in China. As a consequence, they provide NO information about overall Chinese demand trends. The last sentence therefore contradicts the preceding sentence and shines a light on the confusion in the minds of those who attempt to gather useful information about the gold price by fixating on trading volumes.

*For example: HERE, HERE, HERE and HERE.

Print This Post Print This Post
The UEC Controversy

June 22, 2015

Junior uranium producer Uranium Energy Corporation (UEC) has been in the news (in a bad way) over the past few days due to ‘revelations’ contained in an article posted HERE. I put inverted commas around the word revelations in the preceding sentence because there is nothing in the article that should have surprised anyone who has been following the company. I don’t follow the company closely, but I was well aware of the information that seemingly shocked the stock market late last week.

It seems that many holders of the stock were surprised to find out that UEC had essentially stopped producing uranium. They shouldn’t have been, because the company has made no secret of its scaled-back mode of operation. For example, for the past several quarters the company has reported no sales and only small increases in its uranium inventory*, indicating production on a small scale. Also, the CEO of the company sent shareholders a letter in January of this year reminding them that “Palangana [the only in-production project at this time] is operating on a small scale pending ramp-up when the price of uranium is in a viable range.

In other words, with regard to its operational performance UEC doesn’t appear to have tried to hide anything, although the company and many of the people who recommend owning the shares have not been completely forthright (to put it politely). The reason is that if production costs were as low as claimed, UEC’s Palangana project would be solidly profitable at the current spot uranium price and very profitable at the current contract uranium price. Nobody puts a genuinely-profitable mining operation on what is, in effect, “care and maintenance” for an indefinite period pending a rise in commodity prices. Therefore, it’s a good bet that UEC’s total production cost is above $35/pound and that the $20/pound “cash cost” quoted by the company is a misleading figure.

In any case, the problem I have always had with UEC — and the main reason I have never been interested in buying the stock — is its valuation. The company’s market cap has always been disproportionately high relative to the underlying business’s size and assets.

Even now, with the stock price having tumbled from its recent high, the company has a market cap of US$165M at last Friday’s closing price of US$1.80/share. For this market cap you get a company with a book value (BV) of only US$26M. It’s worse than that, however, because the BV itself is suspect. The BV comprises “Property, Plant and Equipment” of only $7M, working capital of only $2M, long-term debt of $20M, and $39M of “Mineral Rights and Properties”. That is, more than 100% of the company’s BV is in the “Mineral Rights and Properties” asset category.

By way of comparison, the current US$93M (pre-Uranerz-takeover) market cap of Energy Fuels (EFR.TO, UUUU), another US-based junior uranium producer, is slightly lower than a book value that is, in turn, more than 100% accounted for by the company’s working capital and “Property, Plant and Equipment”.

In other words, UEC is presently being priced by the market at 6-times a suspect book value while EFR, a comparable company, is presently being priced by the market at around 1-times a solid book value.

Unrelenting promotion of the stock is the most plausible explanation for UEC’s ability to maintain a disproportionately-high market cap for so long. The promotion periodically goes into overdrive and the stock price goes vertical (see chart below). It then gives back the bulk of its gains, but it is never allowed to reach a level at which there is real value before the next promotion gets underway.

UEC_220615

I have ‘no axe to grind’ with UEC and no financial incentive to add to the recent downward pressure on the stock price. I’m just surprised that an article that did nothing other than point out a couple of obvious facts about the company had such a dramatic effect.

*Finished goods (U3O8) inventory rose from 70K pounds at 31st July 2014 to 78K pounds at 31st October 2014 to 81K pounds at 31st January 2015 to 84K pounds at 30th April 2015.

Print This Post Print This Post
Which of these charts is right?

June 19, 2015

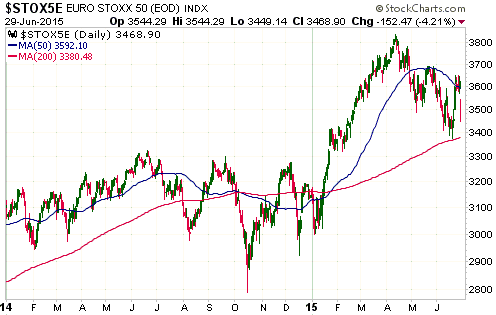
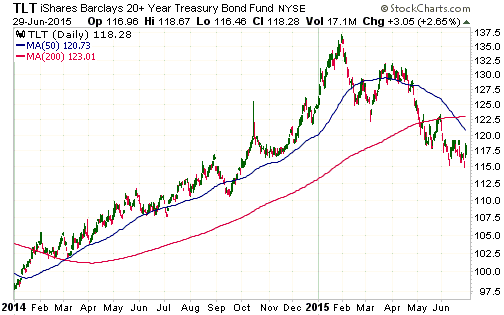
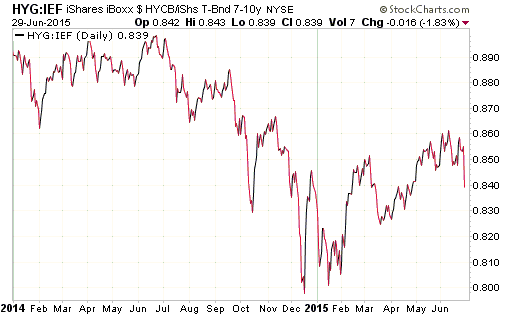
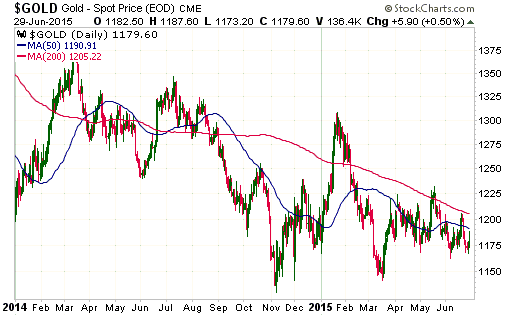
The following charts are sending conflicting signals about gold-related investments. Which one is right? We could find out over the next 2 trading days.

Some commentary relating to these charts will be sent to TSI subscribers within the next couple of hours.

BULLISH:

GDXJ_180615

NEUTRAL:

gold_180615

BEARISH:

HUI_180615

VERY BEARISH:

HUI_gold_180615

Print This Post Print This Post
Sprott versus the Central Gold Trust

June 17, 2015

Late last month Sprott Asset Management made an offer to acquire all of the units of the Central Gold Trust (GTU), a gold bullion investment fund, in exchange for units of Sprott’s own gold bullion investment fund (PHYS) on a net asset value (NAV) for NAV basis. This implied — and still implies — a small premium for GTU unitholders, the reason being that GTU units were — and still are — trading at a discount of several percent to their NAV. GTU’s Board of Trustees subsequently recommended that its Unitholders reject the Sprott Offer for reasons that were outlined in a Trustees’ Circular, which was followed by dueling press releases. What’s the average retail GTU unitholder to do?

To answer the above question it is necessary to consider the benefits, if any, of exchanging GTU units for PHYS units. As far as I can tell and despite the numerous reasons given by Sprott for voting in favour of the proposed unit exchange, there is just one benefit: PHYS, the Sprott bullion fund, offers a physical redemption facility that — although it can only be used by large investors — prevents the units from trading at a sizable discount to NAV.

The thing is, the historical record indicates that GTU units only ever make significant and sustained moves into discount territory during multi-year bearish trends in the gold price. In other words, the historical record indicates that Sprott’s benefit only applies during gold bear markets.

Of course, there’s no guarantee that past is prologue in this case and that GTU’s discount will disappear in the early part of a new multi-year upward trend in the gold price, but recent performance suggests that nothing has changed. As evidence I point to the following chart comparing the US$ gold price and GTU’s premium to NAV (a negative premium is a discount). Notice that the bounce in the gold price from last November’s low of around $1140 to January’s high of around $1300 caused GTU’s discount to shrink from 12% to 4%. It’s not hard to imagine that if the gold price had extended its rally to $1350-$1400, GTU’s discount would have been eliminated.

gold_GTUPREM_160615

Also of potential interest is the next chart showing a comparison between the gold price and the GTU/PHYS ratio. This chart shows that GTU has generally performed better than PHYS in strong gold markets and worse than PHYS in weak gold markets. Again, we can’t be sure that the past is an accurate predictor of the future, but there is no evidence at this stage that anything has changed.

gold_GTUPHYS_160615

Returning to the question “What’s a retail GTU unitholder to do?”, I think the right answer depends on the unitholder’s timeframe. Someone planning to hold GTU during the remainder of the gold bear market and well into the next gold bull market should reject the Sprott offer by taking no action, whereas someone planning to exit within the next few months should accept the Sprott offer.

Print This Post Print This Post
A rational bet you hope to lose

June 15, 2015

The types of bet a person can make can be categorised as follows:

1. A bet where a rational bettor hopes to win and has a reasonable expectation* of winning. For example, someone who buys a stock following careful analysis of potential risk versus reward hopes to obtain a profit and believes that they have put themselves in a position where the expected outcome is a profit. This type of bet is called a speculation or an investment.

2. A bet where a rational bettor hopes to win but knows that the expected outcome is a loss. For example, someone who bets on roulette at a Las Vegas casino should realise that the expected outcome is a loss, but people who bet on roulette are generally hoping to beat the odds. This type of bet is a gamble. Note that many of the people who claim to be speculating/investing are actually gambling, because they haven’t done sufficiently thorough analysis of risk versus reward for their bet to be categorised as a speculation or an investment.

3. A bet where a rational bettor hopes and expects to lose. This type of bet is called an insurance payment.

When you buy insurance you can be very confident that the expected outcome is a loss because anyone prepared to offer you insurance on any other terms will not stay in business for long. Furthermore, a rational and honest person who takes out insurance will be hoping that they will never actually need to cash-in their insurance policy; that is, they will be hoping to lose the money paid for the insurance. For example, someone who buys fire insurance for their home is, in effect, betting that their home will burn down, but this is a bet they will generally be hoping to lose.

Due to the expected outcome being a loss, you should never pay someone to take-on an insurance risk you can afford to take-on yourself. It will, however, make sense to pay for insurance in certain cases. This is because even though the expected outcome is a loss, the consequences of not having the insurance could be devastating. Many people, for instance, would be financially devastated if their home burnt down, so it would probably make sense for them to pay for fire insurance. But it probably wouldn’t make sense for Warren Buffett to have his modest Omaha residence insured against fire because the financial value of his home is miniscule compared to his net worth.

Managing risk in the financial markets is often equivalent to buying insurance. That is, it often involves making a bet you hope and expect to lose, but a bet that makes sense nonetheless because it will prevent you from experiencing severe financial pain if things don’t go according to your best-laid plans.

*When I say “a reasonable expectation of winning” I mean that the expected outcome is a win, which is different from saying that the probability of winning is greater than 50%. For example, a bet that has a 70% probability of yielding a 10% profit and a 30% probability of yielding a 50% loss has an expected outcome of minus 8% [0.7*10 + 0.3*(-50)]. In this case there’s a 70% probability of winning the bet, but a rational person will not make such a bet.

In many real-world situations the probabilities needed to calculate “expected outcome” will not be known, meaning that speculators/investors will be forced to use educated guesses (guesses made after carefully weighing the known facts). These educated guesses will sometimes be wrong, which is why risk management is crucial.

Print This Post Print This Post

The Emotion Pendulum

June 14, 2015

(This post is an excerpt from a recent TSI commentary.)

The stock market is not a machine that assigns prices based on a calm and objective assessment of value. In fact, when it comes to value the stock market is totally clueless.

This reality is contrary to the way that many analysts portray the market. They talk about the stock market as if it were an all-seeing, all-knowing oracle, but if that were true then dramatic price adjustments would never occur. That such price adjustments occur quite often reflects the reality that the stock market is a manic-depressive mob that spends a lot of its time being either far too optimistic or far too pessimistic.

The stock market can aptly be viewed as an emotion pendulum — the further it swings in one direction the closer it comes to swinging back in the other direction. Unfortunately, there are no rigid benchmarks and we can never be sure in real time that the pendulum has swung as far in one direction as it is going to go. There’s always the possibility that it will swing a bit further.

Also, the swings in the pendulum are greatly amplified by the actions of the central bank. Due to the central bank’s manipulation of the money supply and interest rates, valuations are able to go much higher during the up-swings than would otherwise be possible. Since the size of the bust is usually proportional to the size of the preceding boom, this sets the stage for larger down-swings than would otherwise be possible.

The following monthly chart of the Dow/Gold ratio (from Sharelynx.com) clearly shows the increasing magnitude of the swings since the 1913 birth of the US Federal Reserve.

Print This Post Print This Post

There’s no such thing as “money velocity”

June 10, 2015

In the real world there is money supply and there is money demand. There is no such thing as money velocity. “Money velocity” only exists in academia and is not a useful concept in economics or financial-market speculation.

As is the case with the price of anything, the price of money is determined by supply and demand. Supply and demand are always equal, with the price adjusting to maintain the balance. A greater supply will often lead to a lower price, but it doesn’t have to. Whether it does or not depends on demand. For example, if supply is rising and demand is attempting to rise even faster, then in order to maintain the supply-demand balance the price will rise despite the increase in supply.

When it comes to price, the main difference between money and everything else is that money doesn’t have a single price. Due to the fact that money is on one side of almost every economic transaction, there will be many (perhaps millions of) prices for money at any given time. In one transaction the price of a unit of money could be one potato, whereas in another transaction happening at the same time the price of a unit of money could be 1/30,000th of a car. This, by the way, is why all attempts to come up with a single number — such as a CPI or PPI — to represent the price of money are misguided at best.

If money “velocity” doesn’t exist in the real world, why do so many economists and commentators on the economy harp on about it?

The answer is that the velocity of money is part of the very popular equation of exchange, which can be expressed as M*V = P*Q where M is the money supply, V is the velocity of money, Q is the total quantity of transactions in the economy and P is the average price per transaction. The equation is a tautology, in that it says nothing other than the total monetary value of all transactions in the economy equals the total monetary value of all transactions in the economy. In this ultra-simplistic tautological equation, V is whatever it needs to be to make the left hand side equal to the right hand side. In other words, ‘V’ is a fudge factor that makes one side of a practically useless equation equal to the other side.

Another way to express the equation of exchange is M*V = nominal GDP, or V = GDP/M. Whenever you see a chart of V, all you are seeing is a chart of nominal GDP divided by some measure of money supply. That’s why a large increase in the money supply will usually go hand-in-hand with a large decline in V. For example, the following chart titled “Velocity of M2 Money Stock” shows GDP divided by M2 money supply. Given that there was an unusually-rapid increase in the supply of US dollars over the past 17 years, this chart predictably shows a 17-year downward trend in “money velocity”.

Note that over the 17-year period of downward-trending “V” there were multiple economic booms and busts, not one of which was predicted by or reliably indicated by “money velocity”. However, every boom and every bust was led by a change in the rate of growth of True Money Supply (TMS).

M2_velocity
Chart source: https://research.stlouisfed.org/

In conclusion, “money velocity” doesn’t exist outside of a mathematical equation that, due to its simplistic and tautological nature, cannot adequately explain real-world phenomena.

Print This Post Print This Post

Gold isn’t cheap, but nor should it be

June 8, 2015

Although it is not possible to determine an objective value for gold (the value of everything is subjective), by looking at how the metal has performed relative to other things throughout history it is possible to arrive at some reasonable conclusions as to whether gold is currently expensive, cheap, or ‘in the right ballpark’. In particular, gold’s market price can be measured relative to the prices of other commodities, the stock market, the price of an average house, the earnings of an average worker, and the real (purchasing-power-adjusted) money supply. In a recent TSI commentary I looked at the last of these, that is, I looked at gold’s price relative to the real money supply, and arrived at the conclusion that gold’s current price was about 20% above ‘fair value’. I’ll now take a look at gold relative to other commodities.

As illustrated below, over the past 20 years — with the exception of a short-lived spike in 2011 — major swings in the gold/silver ratio have bottomed at around 45 and peaked at around 80. The ratio is currently near the top of its 20-year range, which means that gold is expensive relative to silver.

As a consequence, to argue that there has been a successful long-term price suppression scheme in the gold market you must also argue that there has been a successful long-term price suppression scheme in the silver market. Such arguments have, of course, been put forward, with one analyst claiming that JP Morgan has managed to do the impossible by amassing a large long position in physical silver while simultaneously suppressing the price of silver by selling futures contracts.

gold_silver_080615

The next chart shows that gold is also near a 20-year high relative to platinum, the implication being that gold is expensive relative to platinum.

Consequently, to argue that there has been a successful long-term price suppression scheme in the gold market you must also argue that there has been a successful long-term price suppression scheme in the platinum market. Again, such arguments have been put forward. For example, one analyst has suggested that the daily platinum ‘fix’ in the London market was used to manipulate the price downward over the long-term, even though there was an overall upward bias in the price over the period under analysis. For another example, an analyst has argued that the platinum price has been persistently reduced by the short-selling of platinum futures, an outcome that would only be plausible if every sale of a futures contract didn’t subsequently have to be closed-out via the purchase of a contract and if automotive companies had figured out a way to replace the physical platinum used in catalytic converters with paper contracts.

gold_plat_080615

The final chart shows that gold is presently near an all-time high relative to the CRB Index (an index representing a basket of 17 commodities). This chart therefore shows that gold is expensive relative to commodities in general.

As far as I know, nobody has yet tried to argue that the prices of most commodities are being suppressed as part of a grand plan to conceal the long-term suppression of the gold price. Instead, gold’s expensiveness relative to commodities in general is studiously ignored.

gold_CRB_080615

To summarise the above: gold is currently expensive relative to many other commodities.

Almost regardless of what gold is measured against, it does not look cheap at this time. However, given what is happening to money and economies around the world, there is logic to the fact that gold is relatively expensive right now. Also, it is logical to expect that gold is going to get a lot more expensive within the next few years.

As I’ve explained in the past, gold is not now and has never been a play on “CPI inflation”. Of course, on a very long-term (multi-generational) basis the gold price will tend to rise by enough to offset the decline in the purchasing power of money, but so will the prices of many other assets. What makes gold special is that it is the premier long-term hedge against bad monetary and fiscal policies.

Gold isn’t cheap right now, but in a world that is rife with bad monetary and fiscal policies it is destined to become a lot more expensive.

Print This Post Print This Post

Worry about capital controls, not gold confiscation

June 5, 2015

Due to the confiscation of gold by the Roosevelt Administration in 1933, there remains an undercurrent of concern among gold owners that the US government or another major government will confiscate gold in the future. However, the risk of this happening is presently so low as to not be worth taking into account. Of far greater risk are capital controls and the confiscation of cash.

Gold confiscation is not a realistic threat under the current monetary system, because under the current system gold isn’t money. To further explain, the reason that gold was confiscated in the US in 1933 was that gold, at that time and place, was money, with the dollar essentially being a receipt for gold. Consequently, the amount of gold in the banking system placed a limitation on the quantity of dollars. By making gold ownership illegal the US government not only prevented the public from removing gold from the banking system, thus eliminating one of the superficial deflationary forces, it also pushed additional gold into the banking system and paved the way for greater monetary inflation.

Today, gold imposes no limitations on the abilities of the government and its agents to spend, borrow and inflate, so there is no reason for the government to confiscate it or even to care about it.

As an aside, in the 1930s the US government confiscated silver shortly after it confiscated gold, even though silver wasn’t official money at the time. However, the primary reason for the silver confiscation was the same as the reason for the gold confiscation — to pave the way for greater monetary inflation. As part of an effort to increase the money supply, the confiscated silver was put directly into the monetary base by turning it into legal tender in the form of coins or silver certificates. The 1934 silver nationalisation order actually brought silver back into the monetary system, where it remained until the early-1960s.

What the government wants to control is the official money, which in 1933 was gold and today is the dollar or some other fiat currency. The government is therefore focused on monitoring/controlling the flow of today’s currency units, which means that you are at far greater risk of having your cash confiscated or restricted in some way than having your gold confiscated.

Moreover, capital controls aren’t just a potential future problem, they exist in almost every country today. In almost every country there are already restrictions on a) the transfer of money across national borders, b) the transfer of money between different account-holders, and c) the amount of deposit currency that can be converted to physical cash. If these aren’t capital controls by another name, what are they?

Capital controls are likely to become more draconian over time. People with significant financial assets should therefore already be managing the capital-controls risk by diversifying their assets internationally*. Also, everyone (especially US citizens), including those who don’t yet have significant financial assets to protect, should have a second passport as a guard against future restrictions on freedom.

*If you are concerned about gold confiscation then you could also manage this risk by distributing your gold across vaults in different countries. This is easy to do via Bullionvault.com or the new BitGold service.

Print This Post Print This Post

Rallying against the Chinese invasion of Australia

June 3, 2015

According to the fellow in the video shown below, the Chinese are invading Australia. It isn’t a military invasion, it’s an economic invasion that involves the buying-up of Australian real estate and has caused young Australian families to be priced out of the property market. The solution, apparently, is for the Australian federal government to stop turning a blind eye to this flood of foreign investment and, instead, to put a stop to it, thus resuscitating the “Australian dream”. Unfortunately, the star of the video is both ethically and economically wrong. He is ethically wrong because he is advocating the widespread violation of property rights (he wants the government to dictate who Australian property owners can sell to, with the particular aim of preventing the sale of property to buyers who live in China), but it’s the economic error I’m going to deal with in this post.

Our ‘the-government-oughta-do-something-to-stop-the-Chinese-real-estate-invasion’ protest organiser and You-Tuber is unaware of two important economic realities, the first and lesser important of which is that Australia runs a large current-account deficit. This deficit, which comprises dividend payments, interest payments on foreign debt and a surplus of imports over exports, is running at around A$40B per year. This means that about $40B per year is ‘flowing’ out of the country on the current account, which means that about $40B/year of new investment MUST flow into the country (since nobody has any use for Australian dollars outside Australia). In other words, the current account deficit necessitates $40B per year of net foreign investment, approximately a quarter of which goes into real estate.

The more important economic reality of which our irrepressible video presenter is unaware is Australia’s rapid rate of monetary inflation. Thanks to the activities of the Reserve Bank of Australia (RBA) and the commercial banks, the supply of Australian dollars has risen by 13% over the past 12 months and 44% over the past 4 years. With this rate of money-supply growth and low interest rates it is no wonder that houses have become very expensive. With this monetary backdrop, houses would almost certainly have become very expensive even if China didn’t exist. Furthermore, a rapid rate of monetary inflation tends to increase the current account deficit and weaken the currency on the foreign exchange market, thus putting more of the currency in the hands of foreign investors and simultaneously making domestic property prices look cheaper to foreign investors.

So, if the guy in above video had a better understanding of economics he’d be organising a protest outside the RBA headquarters instead of the Chinese consulate.

Print This Post Print This Post

The ‘great’ gold debate

June 1, 2015

The title of this post refers to the debate between Jeff Clark and Harry Dent about gold’s prospects over the next 2 years, with Harry Dent arguing for a collapse in the gold price to less than $700/oz and Jeff Clark arguing in favour of a bullish outcome. I put inverted commas around the word great, because neither participant in this debate made a good argument. However, while the Clark side of the debate could have been a lot better, the Dent side was a stream of complete nonsense. In this post I’ll deal with a couple of the flaws in Dent’s analysis and also briefly address the extremely persistent deflation fantasy that lies at the core of Dent’s latest big prediction*.

An important point to understand is that gold is not now, and has never been, a play on “CPI inflation”. As I stated in an earlier post: “Gold is a play on the economic weakness caused by bad policy and on declining confidence in the banking establishment (led by the Fed in the US). That’s why cyclical gold bull markets are invariably born of banking/financial crisis and/or recession, and why a cyclical gold bull market is more likely to begin amidst rising deflation fear than rising inflation fear.” Jeff Clark barely touches on this key point, while Harry Dent believes that the point is invalidated by the fact that the gold price fell by 33% during part of the 2008 financial crisis.

Harry Dent keeps returning to gold’s performance during 2008 and provides no other historical examples of gold performing poorly in times of financial crisis. He therefore either has very little knowledge of gold’s historical record or he believes that hundreds of years of history were negated by what happened during 2008. Either way, he is misinformed, because gold outperformed the US$ over the course of 2008. The 33% decline is from the best level of the year to the worst level of the year, but even this sizeable peak-to-trough loss was fully eradicated by the first quarter of 2009. Moreover, if we consider the entire Global Financial Crisis (GFC), with the 10th October 2007 closing high for the S&P500 marking its beginning and the 10th March 2009 closing low for the S&P500 marking its end, we find that gold gained 24% in US$ terms and 34% in euro terms over the course of the crisis.

Information that must always be taken into account when assessing gold’s performance in reaction to events is the gold-price starting point. The reason that gold was initially hit hard in US$ terms during the general market crash of 2008-2009 is largely due to the US$ gold price being ‘overbought’ and at a multi-decade high just prior to the crash, which is obviously not the case today. Furthermore, as I mentioned above it quickly recouped its losses.

And information that must be taken into account when assessing the performances of all the financial markets during the GFC of 2007-2009 is that the Fed did not begin to pump-up the US money supply (properly measured via TMS) until September of 2008. From September of 2007 through to August of 2008 the Fed cut interest rates, but the monetary inflation rate remained at a low level. Since there is no longer any scope to cut interest rates, it’s a virtual certainty that the Fed’s initial response to a deflation scare in the not-too-distant future would involve ramping-up the money pumps.

In addition to presenting gold’s GFC performance in a misleading way, there are numerous problems with Dent’s argument. Due to time constraints I’m only going to deal with one of them. Here’s the relevant excerpt:

The gold bug camp is constantly telling us that governments are debasing our currency, especially the almighty US dollar and destroying the value so that the dollar is not a good store of value. I 100% disagree.

Here’s an analogy to explain: Since its invention in 1971, the microchip has been multiplied by the trillions, creating a revolution in human communications. Its evolution is a crystal-clear sign of progress and of a higher standard of living. Translating that back to the dollar argument, if the exponential multiplication of the microchip was (is) a good thing, why would the multiplication of dollars not also be a sign of progress that similarly fosters a revolution in urbanization, more complex and rich specialization of skills, and an improved standard of living? Increasing urbanization leads to rising affluence and the need for greater dollars for transactions in a more complex urban society!

This may be the stupidest economics-related comment I’ve ever read from a trained economist, which is saying something considering the competition. It implies that he doesn’t know the difference between a rise in the quantity of the medium of exchange and a rise in the quantity of real wealth. It implies that he sees no difference between the private sector increasing the supply of labour-saving or life-sustaining or life-enhancing products and central banks creating new money out of nothing. Also, he apparently perceives the factual decline in the US dollar’s purchasing power as a goldbug delusion.

Harry Dent should not be taken seriously, but the view that deflation is coming should not be dismissed out of hand. Also, it is possible to make a legitimate gold-bearish argument, it’s just that Harry Dent hasn’t done it.

Under the current monetary system and the theories that dominate central banking, true deflation — such as occurred in the US during 1930-1932 — has a near-zero probability of happening. In the future there could (almost certainly will) be changes to the monetary system and/or the political environment that pave the way for true deflation, but that’s not something that has a realistic chance of happening over the next two years. In the meantime, there will probably be another deflation scare.

While it’s in progress a deflation scare will look and feel like 1930s-style deflation to most people. The difference is that you don’t get the economic ‘reset’ that would be caused by true deflation. Instead, policy-makers react to the scare by 1) aggressively injecting new money into the economy, 2) ensuring that the total volume of credit continues to grow, and 3) generally doing whatever it takes to prop-up prices. In doing so they add new imbalances to the existing imbalances.

Deflation scares are very bullish for gold. That’s why the deflation scare of 2001-2002 set in motion a large multi-year advance in the gold price and why the deflation scare of 2007-2009 set in motion a large multi-year advance in the gold price. If another deflation scare gets underway this year then so, in all likelihood, will another large multi-year advance in the gold price.

Looking out over the coming 1-2 years, the risk for gold isn’t that there will be true deflation, because that’s a virtual impossibility under the current monetary set-up. Nor is the realistic possibility of a deflation scare a risk for gold, since such a development would create a very gold-bullish fundamental backdrop. Rather, the risk for gold is a continuation of the monetary-inflation-fueled boom of the past few years.

In effect, the main risk for gold is an economic outcome that is almost the OPPOSITE of what Harry Dent is predicting.

*Harry Dent’s modus operandi is to come out with a new ‘big prediction’ almost every year. This creates a media buzz that facilitates the sale of books. If a big prediction doesn’t pan out, no problem — just make another one. Eventually, one will hit the mark. In the early-1990s he got lucky and correctly predicted the ensuing boom (it was blind luck because his reasoning was wrong). If he gets lucky again, he’ll have a track record to shout from the hilltops.

Print This Post Print This Post