Sidebar left

The evidence be damned!

June 23, 2016

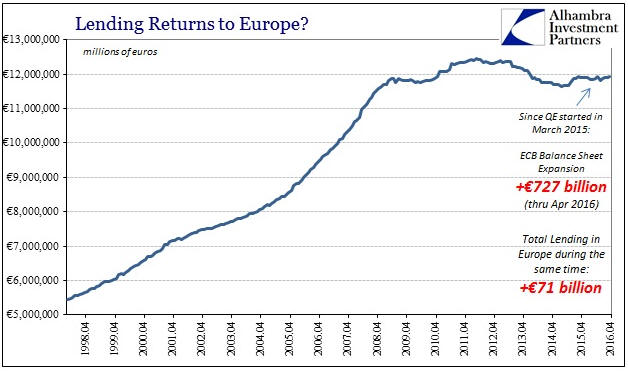
I was blown away by the following two charts from Jeffrey Snider’s article titled “The European Basis For New Monetary Science“.

As most of you probably know, the Mario Draghi-led ECB embarked on a ‘suped-up’ QE program in March of 2015. The idea behind this program was that by monetising 60B euros of bonds per month the ECB would promote faster credit expansion throughout Europe. The two charts from the aforelinked Snider article show the results to April-2016.

The first chart shows that as at April-2016, 727 billion euros of ECB asset monetisation had been accompanied by an increase in total lending of only 71 billion euros. As neatly summarised by Snider, this means that there was less than one euro in additional lending for every ten in ECB foolishness.

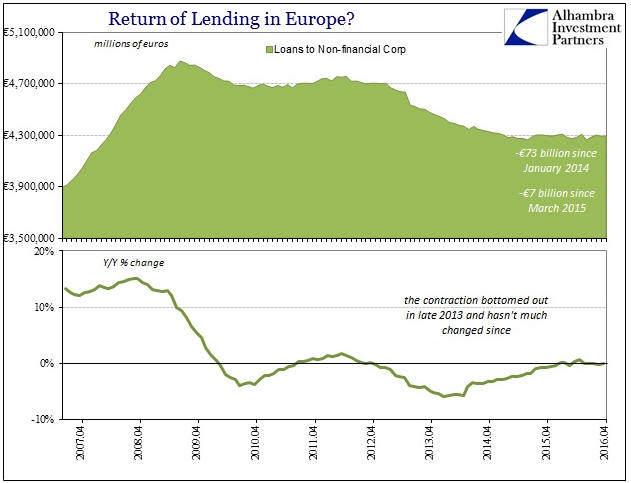
The second chart shows loans to European non-financial corporations, which actually contracted slightly during the first 13 months of the ECB’s suped-up credit-expansion program.

EZlending_total_220616

EZlending_NFC_220616

The QE program was therefore a total failure even by the jaundiced standards of the central-banking world, that is, it failed even ignoring the reality that faster credit expansion cannot possibly be good for an economy labouring under the weight of excessive debt. The weirdest thing is, the obvious failure is not viewed by Draghi as evidence that QE doesn’t do what it is supposed to do. Instead, it is viewed as evidence that more of the same is needed. Hence the increase in the pace of asset monetisation from 60B to 80B euros per month announced in March-2016 and implemented this month.

I shudder to think how Draghi’s monetary experiment will end.

Print This Post Print This Post

Central bankers believe that they can provide free lunches

June 20, 2016

[This post is a modified excerpt from a recent TSI commentary.]

A lot of good economic theory boils down to the acronym TANSTAAFL, which stands for “There Ain’t No Such Thing As A Free Lunch”. TANSTAAFL is an unavoidable law of economics, because everything must be paid for one way or another. Furthermore, attempts by policymakers to get around this law invariably result in a higher overall cost to the economy. Unfortunately, central bankers either don’t know about TANSTAAFL or are naive enough to believe that their manipulations can provide something for nothing. They seem to believe that the appropriate acronym is CBCCFLAW, which stands for “Central Banks Can Create Free Lunches At Will”.

ECB chief Mario Draghi is the leader in applying policies based on CBCCFLAW. Despite his economic stimulation measures having a record to date that is unblemished by success, he recently launched new attempts to conjure-up a free lunch.

I’m referring to two measures that were announced in March and have just started to be implemented, the first of which is the ECB’s corporate bond-buying program (starting this month the ECB will be monetising investment-grade corporate bonds in addition to government bonds). This program is designed to bring about a further reduction in interest rates, because, as we all know, if there’s one thing that’s holding Europe back it’s excessively high interest rates, where “excessively high” means above zero.

Unlike the situation in the US, very little corporate borrowing in Europe is done via the bond market. The ECB’s new corporate bond-buying program is therefore unlikely to provide even a short-term boost, but, not to worry, that’s where the ECB’s second measure comes into play.

The ECB’s second measure is a new round of a previously-tried program called the Targeted Long Term Refinancing Operation (TLTRO). Under the TLTRO program, commercial banks get encouraged — via a near-zero or negative interest rate — to borrow money from the ECB on the condition that the banks use the money to make new loans to the private sector.

The combination of the ECB’s two new measures is supposed to promote credit expansion and higher “inflation”. In other words, to the extent that the measures are successful they will result in more debt and a higher cost of living. In Draghi’s mind, this would be a positive outcome.

In the bizarre world occupied by the likes of Draghi, Yellen and Kuroda, the failure of an economy to strengthen in response to a policy designed to stimulate growth never, ever, means that the policy was wrong. It always means that not enough was done. It’s not so much that these central planners refuse to see the flaws in their policies, it’s that they cannot possibly see. They cannot possibly see because they are looking at the world through a Keynesian lens. Trying to understand how the economy works using Keynesian theory is like trying to understand the movements of the planets using the theory that everything revolves around the Earth.

So, the worse things get in response to counter-productive ‘economic stimulation’ policies, the more aggressively the same sorts of policies will be applied and the worse things will eventually get. This is what I’ve referred to as the Keynesian death spiral.

Print This Post Print This Post

Reversals

June 17, 2016

The price action in many financial markets was nothing if not interesting on Thursday 16th June. Of particular interest, there were several price reversals that could be significant (for TSI subscribers, the significance will be discussed in this weekend’s commentary).

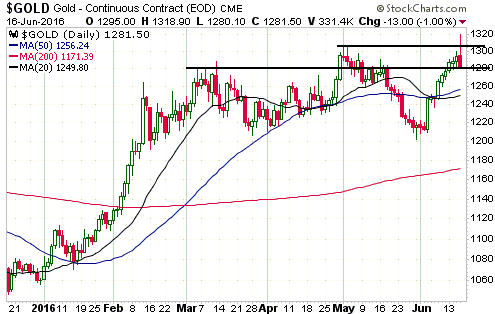
One reversal of potential consequence happened in the gold market, with the gold price moving well above its early-May high and last year’s high ($1308) before turning around and ending the day with a loss.

gold_160616

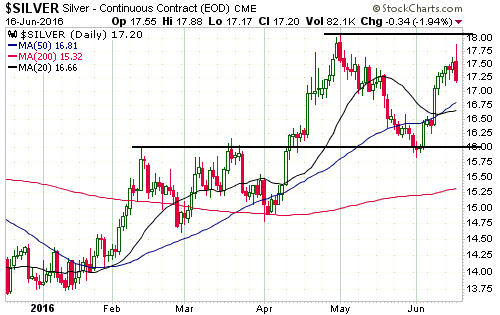
Another reversal happened in the silver market. Silver’s reversal looks more important than gold’s because it resulted in an “outside down day” and created a bearish divergence between the gold and silver markets (a new high for gold combined with a lower high for silver).

silver_160616

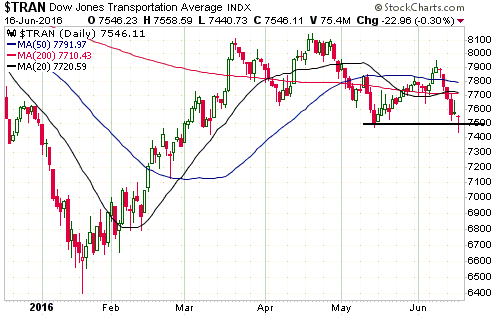
Not surprisingly, the downward reversal in gold coincided with an upward reversal in the US stock market. For example, the Dow Transportation Average, which has led the more-senior US stock indices over the past 18 months, broke below short-term support early on Thursday and then recovered to end the day above support.

TRAN_160616

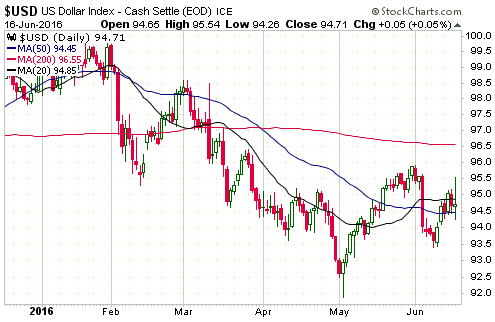
In the currency market there were actually two reversals, with the Dollar Index first reversing upward after trading well below the preceding day’s low and then reversing downward after trading well above the preceding day’s high to end the day roughly unchanged.

US$_160616

The financial markets are obviously being buffeted by Brexit-related news and are likely to remain more news-dependent than usual for another 1-2 weeks.

Print This Post Print This Post

I don’t love charts!

June 15, 2016

Chris Powell of GATA has taken issue with my recent blog post titled “Four charts that invalidate the gold price suppression story“. Interestingly, he did so without addressing the most important information in my short post. Instead, he dismissed the information because it was presented in chart form and simply regurgitated the usual GATA rhetoric*.

Responding to Powell’s article is not a good use of my time. This is not because my time is so precious, but, as mentioned above, because Powell’s article sidesteps the main points. If he develops an understanding of gold’s fundamental price drivers and employs this understanding to demonstrate errors in my thinking, I’ll gladly respond.

However, just to set the record straight:

1) I don’t have anything against technical analysts, but I’m not one of them. I do use some TA, but I’m primarily a fundamental analyst. Unbeknownst to Chris Powell, charts can be used to show fundamental relationships.

2) If my main purpose in writing was to increase the number of subscribers to my newsletter then I would pay lip service to GATA’s arguments. The reason is that I have lost many subscribers over the years due to my regular disparaging of these arguments. While I don’t go out of my way to lose subscribers, this is not a major concern because I am a trader/investor who happens to write a newsletter as opposed to someone who relies on newsletter sales to make a living.

3) Unlike Chris Powell, I am not promoting an agenda. I am not trying to sell a particular view of the financial world. Instead, I’m focused on trying to understand why the markets do what they do and profiting from it. Sometimes I get it right, sometimes I get it wrong. When I get it wrong, I acknowledge that the blame is 100% with me and try to learn from the experience so that the mistake is not repeated.

*He used exactly the same tactic in response to a previous blog post of mine.

Print This Post Print This Post

Four charts that invalidate the gold-price suppression story

June 13, 2016

Every experienced trader knows that the financial markets are manipulated. They always have been manipulated and they always will be manipulated. Railing against gold-market manipulation is therefore akin to railing against the Earth revolving around the sun. Moreover, the attempts to manipulate, which, by the way, will be designed to move prices upward just as often as downward, will never be effective beyond the very short-term. As evidenced by the following charts, there is certainly no sign of a successful long-term gold-price suppression scheme.

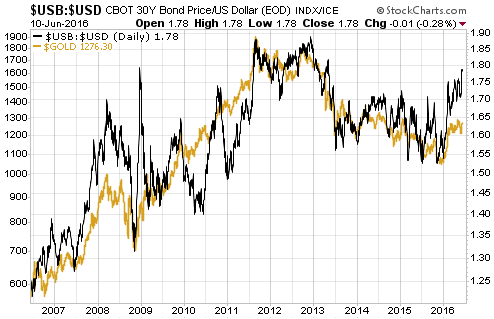
The first chart compares the US$ gold price with the bond/dollar ratio (the T-Bond price divided by the Dollar Index). This chart shows that the gold price has roughly done what it should have done, considering what was happening in the currency and bond markets, each step of the way over the past 10 years.

gold_USBUSD_130616

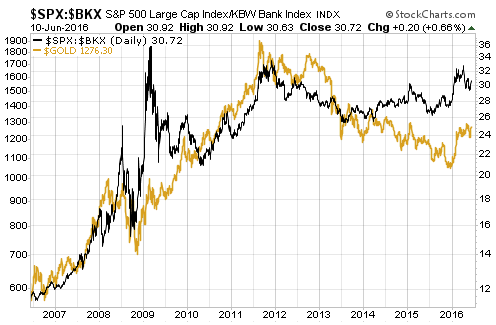
The next chart compares the US$ gold price with the SPX/BKX ratio (the broad US stock market relative to the banking sector). Those who understand gold would expect to see a positive correlation between the gold price and the SPX/BKX ratio, because gold should benefit from falling confidence in the banking sector and become less desirable during periods when investors are becoming increasingly confident in the banking sector’s prospects. There are naturally periods of overshoot and undershoot, but a positive correlation is readily apparent.

gold_SPXBKX_130616

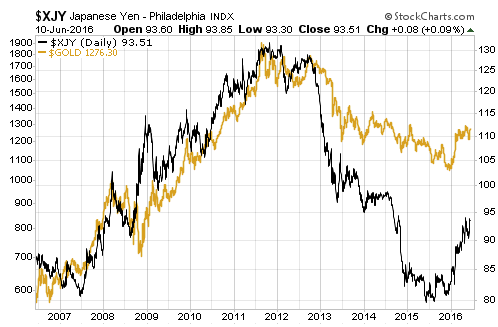
The third chart compares the US$ gold price and the Yen (the Yen/US$ rate). The gold price held up much better than the Yen during 2013-2015, but the positive correlation has been maintained.

Due to the Yen carry trade, gold’s positive correlation with the Yen has been stronger than its negative correlation with the Dollar Index for at least the past 10 years. The Yen carry trade causes the Yen to behave like a safe haven (even though it isn’t one), because carry trades tend to get put on during periods of rising confidence and taken off during periods of falling confidence.

gold_yen_130616

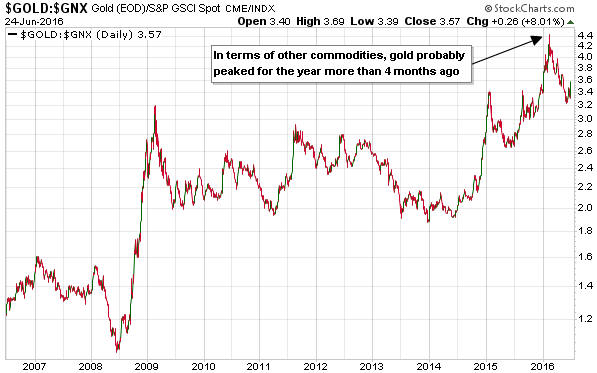
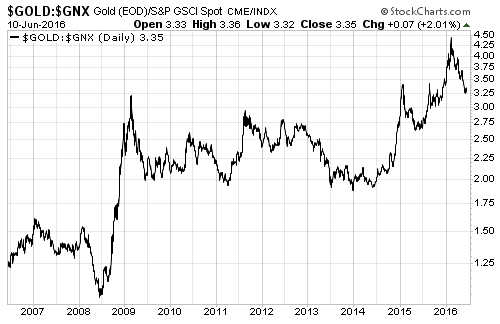
The final chart simply shows the gold/commodity ratio (gold relative to a basket of commodities represented by the Goldman Sachs Spot Commodity Index – GNX). This chart indicates that relative to commodities in general gold is almost 3-times as expensive today as it was 10 years ago. Also, for anyone who clearly remembers what happened in the financial world over the past 10 years it reveals that large and sharp rises in the gold/commodity ratio occurred exactly when they should have occurred — during periods of crisis and plunging confidence. Specifically, there were large and sharp rises: a) from mid-2015 through to early-February of 2016 as equity markets tanked around the world, b) in late-2014 and early-2015 as the financial markets fretted over what the ECB was going to do, c) in the second and third quarters of 2011 in parallel with a substantial stock-market correction and rising fears of euro-zone government debt default, and d) from mid-2008 through to February-2009 in response to the Global Financial Crisis.

By the way, gold is in a multi-generational upward price trend relative to commodities that dates back to 1971.

gold_GNX_130616

I look at a lot of charts comparing gold’s performance with various financial-market and economic indicators, only four of which are presented above. The overarching message is that if gold has been subject to a long-term price suppression scheme, the scheme has been totally unsuccessful.

Print This Post Print This Post

Gold and the Keynesian Death Spiral

June 8, 2016

Almost anything can be a good investment or a bad investment — it all depends on the price. Relative to the prices of other commodities the gold price is high by historical standards and in dollar terms gold is nowhere near as cheap today as it was 15 years ago, but considering the economic backdrop it offers reasonable value in the $1200s. Furthermore, considering the policies that are being implemented and the general lack of understanding on display in the world of policy-making, there’s a good chance that gold will be much more expensive in two years’ time.

The policies to which I am referring are the money-pumping, the interest-rate suppression and the increases in government spending that happen whenever the economy and/or stock market show signs of weakness. These so-called remedies are actually undermining the economy, so whenever they are applied in response to economic weakness they ultimately result in more weakness. It’s not a fluke, for example, that the most sluggish post-recession economic recovery of the past 60 years went hand-in-hand with history’s most aggressive demand-boosting intervention by central banks and governments.

It’s a vicious cycle that can aptly be called the ‘Keynesian death spiral’. The Keynesian models being used by policy-makers throughout the world are based on the assumption that when interest rates are artificially lowered and new money is created and government spending is ramped up, the economy gets stronger. The models are completely wrong, because falsifying price signals leads to investing errors and therefore hurts, not helps, the overall economy, and because the government doesn’t have a spare pile of wealth that it can put to work to create real growth (everything the government spends must first be extracted from the private sector). However, the models are never questioned.

When a sustained period of economic growth fails to materialise following the application of the demand-boosting remedies, the conclusion is always that the remedies were not applied with sufficient vigor. More of the same is hence deemed necessary, because that’s what the models indicate. It’s akin to someone with liver damage caused by drinking too much alcohol being guided by a book that recommends addressing the problem by increasing alcohol consumption. A new dose of alcohol will initially make the patient feel better at the same time as it adds to the existing damage, just as a new dose of demand-boosting intervention will initially make the economy seem stronger at the same time as it gets in the way of genuine progress.

The upshot is that although gold is more expensive today than it was 15 years ago, the level at which gold offers good value is considerably higher today than it was back then because we are now much further along the Keynesian death spiral.

Print This Post Print This Post

TANSTAAFL and the present-future tradeoff

June 7, 2016

When the central bank lowers interest rates in an effort to prompt greater current spending it brings about a wealth transfer from savers to speculators of various stripes. While this is unethical, in economics terms the ethical problemĀ isn’t the main issue. The main issue, and the reason that monetary stimulus doesn’t work as advertised, is TANSTAAFL (There Ain’t No Such Thing As A Free Lunch). At a very superficial level (the level at which all Keynesian economists operate) the interest-rate suppression policies appear to provide a free, or at least a very cheap, lunch, but the bill ends up being much higher than it would have been if it had been paid up front.

The likes of Bernanke, Yellen, Draghi and Kuroda admit that their so-called “monetary accommodation” hurts savers in the present, but they claim that the benefits to the overall economy outweigh the disadvantages to savers. Central bankers are apparently — at least in their own minds — endowed with a god-like wisdom that enables and entitles them to determine who should become poorer and who should become richer, all with the aim of elevating the economy. For example, here’s how the ECB justified its interest-rate suppression policy in June of 2014:

The ECB’s interest rate decisions will…benefit savers in the end because they support growth and thus create a climate in which interest rates can gradually return to higher levels.

And:

A central bank’s core business is making it more or less attractive for households and businesses to save or borrow, but this is not done in the spirit of punishment or reward. By reducing interest rates and thus making it less attractive for people to save and more attractive to borrow, the central bank encourages people to spend money or invest. If, on the other hand, a central bank increases interest rates, the incentive shifts towards more saving and less spending in the aggregate, which can help cool an economy suffering from high inflation. This behaviour is not specific to the ECB; it applies to all central banks.

It’s now two years later and the ECB is heading down the same policy path despite the complete absence of any success. The benefit that savers are supposedly going to get “in the end” appears to be even further away now than it was back then, although it is fair to say that European savers have definitely got it ‘in the end’.

Only the final sentence of the above excerpt is true (it’s true that the ECB is just as bad as other central banks). In order to believe the rest, you must have a poor understanding of economic theory.

‘Time’ is the most important element that central bankers deliberately or accidentally ignore when they make the sort of statements included in the above ECB quote. Increased saving does not mean reduced spending; it means reduced spending on consumer goods in the present in exchange for greater spending on consumer goods in the future. By the same token, reduced saving does not mean increased spending; it means increased consumer spending in the present in exchange for reduced consumer spending in the future.

Isn’t it obvious that this tradeoff between current and future consumer spending will happen most efficiently and for the greatest benefit to the overall economy if it is allowed to happen naturally, that is, if interest rates are allowed to reflect peoples’ actual time preferences? To put it another way, isn’t it obvious that if people are in a financial position where it makes sense for them to increase their saving (reduce their current spending on consumer goods) in order to repair balance sheets that have been severely weakened by excessive prior consumer spending, then the WORST thing that a policymaker could do is put obstacles in the way of saving and create artificial incentives for additional borrowing and consumption?

It obviously isn’t obvious, because monetary policymakers around the world continue to do the worst things they could do.

Print This Post Print This Post

Gold and another Fed rate hike

June 2, 2016

(This post is an excerpt from a commentary published at TSI late last week. Note that an explanation of why a hike in the Fed Funds rate no longer entails monetary tightening can be found in a March-2015 post at the TSI blog.)

In early-November of last year we predicted that a tradable gold rally would begin near the mid-December FOMC Meeting as long as the Fed did what almost everyone was expecting and implemented its first rate hike in more than 8 years. Our reasoning was explained as follows in the 4th November Interim Update:

Looking beyond the knee-jerk reactions to the news of the day, we see a gold market stuck in limbo. In this no-man’s land between a definitively-bullish and a definitively-bearish fundamental backdrop for gold, the US$ gold price works its way higher during periods when it seems that the start of the Fed’s rate-hiking is being pushed out and works its way lower during periods when it seems that the start of the Fed’s rate-hiking is being brought forward.

To get out of this ‘limbo’ and into a situation where a more substantial gold rally is probable, it appears that one of two things will have to happen. Either the Fed will have to take the first step along the rate-hiking path, or the economic/stock-market situation will have to become bad enough that additional monetary easing will be the Fed’s obvious next move. In other words, the Fed will have to stop vacillating and move one way or the other.

Although counterintuitive, there are two good reasons to expect that a Fed rate hike would usher-in a more bullish period for gold. The first reason is that it would potentially be a “sell the rumour buy the news” situation. We are referring to the fact that when a market sells off in anticipation of ostensibly-bearish news, the arrival of the actual news will often lead to a wave of short-covering and an upward price reversal. The second and more interesting reason is that it would spark the realisation that in the current circumstances a Fed rate hike does not entail monetary tightening.

As it turned out, the Fed went ahead and implemented its first rate hike in mid-December and a strong upward trend in the gold price got underway less than 48 hours later.

The reason for bringing this up isn’t to brag about getting something right; it’s to point out that gold now appears to be stuck in a similar situation to the one we described on 4th November. As was the case back then, to ignite the next tradable gold rally it appears that the Fed will have to stop vacillating. Either the Fed will have to take its second step along the rate-hiking path or the economic/stock-market situation will have to become bad enough that all thoughts of a 2016 rate hike are wiped out.

Print This Post Print This Post
Checking on the China ‘gold fix’

May 27, 2016

On 19th April the Shanghai Gold Exchange (SGE) began quoting a twice-daily gold-price ‘fix’ in Yuan terms. Some pundits claimed that this would give the gold price a large and sustained boost. My view was that beyond short-lived fluctuations driven by the vagaries of speculative sentiment, it was irrelevant*. It was, in my opinion, just another in a long line of distractions from gold’s true fundamental drivers.

I went on to marvel, in a blog post on 26th April, at the inconsistency of those who regularly complain about gold-market manipulation by banks and also cheered the news that the Chinese government and its subservient banks had implemented a “Yuan gold fix”.

Is the manipulation-fixated pro-China camp totally oblivious to what happened over the past 10 years? It would have to be to not realise that modern-day China has been one of the greatest forces for global price distortion the world has ever known. The idea that China could be responsible for honest price discovery for any commodity gives stupid a bad name.

Anyhow, there is no evidence that the gold price is lower than it should be considering this market’s true fundamental price drivers. Of course, to know that this is the case you have to know what the true fundamentals are. You can’t, as many gold commentators do, blindly assume that gold’s fundamentals are always bullish regardless of what’s happening in the world. If you want to be logical you also can’t determine anything useful about the gold price by analysing the shifts in gold from one location to another.

If the implementation of the “Yuan gold fix” had been followed by the price explosion that some promoters were forecasting it would have been a lucky coincidence. As things turned out, the gold price has dropped a little over the past month, which is not surprising considering the fundamentals that matter.

*In a report posted at TSI on 17th April I wrote: “…the Yuan gold fix will have no effect on gold’s true fundamentals and will therefore have no effect on gold’s intermediate-term or long-term price trends. It shouldn’t even have an effect on gold’s short-term price performance, although whether it does or not will largely depend on the vagaries of speculative sentiment.”

Print This Post Print This Post

Which of these markets is wrong?

May 25, 2016

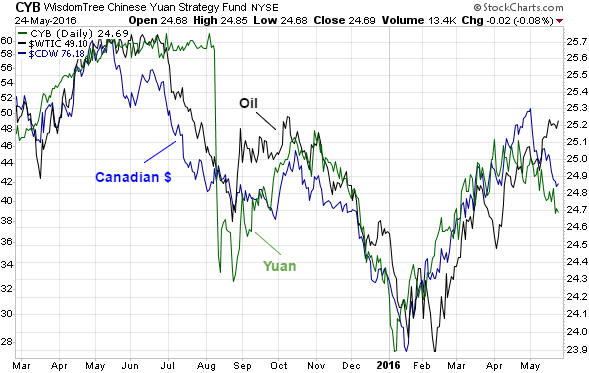
The following chart shows that the US$ oil price, the Canadian Dollar and the Yuan (represented on the chart by the WisdomTree Yuan Fund – CYB) have tracked each other closely over the past 15 months. When divergences have happened, they have always been quickly eliminated.

An interesting divergence has been developing over the past few weeks, with the Yuan having turned downward in mid-April, the C$ having turned downward at the beginning of May and the oil price having continued to rise. Either the currency market is wrong or the oil market is wrong. My money is on the oil market being wrong.

One reason to suspect that the oil market is wrong and that the divergence will therefore be eliminated by a decline in the oil price is recent history. In the second quarter of last year the C$ turned downward about 6 weeks ahead of the oil price and in the first quarter of this year there was an upturn in the Yuan followed by an upturn in the C$ and lastly an upturn in the oil price. That is, the currency market has been leading at turning points.

oil_CYB_C$_240516

Print This Post Print This Post

Nobody Knows Anything

May 24, 2016

Nobody Knows Anything” is a new book written by Bob Moriarty, the proprietor of the 321gold.com web site. It’s close to the book that I would write about investing, but Bob is a better writer than I so it is just as well that he wrote the book before I got around to it.

Achieving good returns by trading/investing in the stock market and other financial markets isn’t complicated. While a certain amount of information gathering and historical knowledge is required, achieving good returns has a lot to do with common sense. However, this doesn’t mean that it is easy. The problem is that we are most comfortable when running with the herd, but herds never have common sense and the investing herd always ends up losing money.

In the chapter on contrarian investing, Bob rightly points out that one of the keys to long-term investing success is not following the herd as it careens from one wealth-destroying blunder to the next.

Many people want to be told what the markets are going to do in the future and especially want to be given specific information about future crashes and spectacular price rises. This creates money-making opportunities for self-styled gurus.

As Bob explains in his book, there are no gurus. Nobody knows exactly when prices will rise, fall, peak and trough, but there is no shortage of people who will happily take your money in exchange for pretending to give you this extremely useful information. What these people are actually giving you are guesses dressed up to look like scientific analyses.

The fact is that in order to consistently buy low and sell high you don’t need to know, or even have an opinion about, when and at what level a market will peak or trough, but advice that helps you manage money prudently will not attract new readers/followers anywhere near as quickly as a big forecast such as “the market will peak on Date X and then plummet by 50%”. As I’ve noted in the past, there is an asymmetric risk/reward to making the big, bold forecast, because failed forecasts are soon forgotten whereas a single correct forecast (guess) about a dramatic market move can be used for promotional purposes forever.

There are many real-life examples in Bob’s book that are directly or indirectly related to the veritable industry that has grown up over the past 18 years around gold and silver manipulation. After explaining that all markets have always been manipulated, Bob delves into some of the silly stories that have been concocted and the terms that have been invented to promote the idea that the gold and silver markets have been subject to a successful multi-decade price-suppression scheme. Because it’s a fact that all financial markets are always manipulated to some extent, it is not difficult to find information that can add a ring of plausibility to a manipulation story that is not only wrong, but would be irrelevant to an investor or trader even if it were right.

Read the book to find out what Bob thinks about the “gold derivatives time bomb”, the possibility of a “commercial signal failure” in the gold market, the risk of a COMEX default, the notion that the “commercials” in the gold futures market are constantly trying to limit up-moves in the price, “naked shorts”, gold-plated tungsten bars, and the story that the 1998 Fed bailout of Long Term Capital Management (LTCM) was at least partly due to LTCM’s short position in gold.

The most important chapter in the book is probably the one titled “When to Sell”, because failing to take money off the table at an appropriate time gets many investors into trouble. Even in cases where an investor does a good job with the buy side of the equation and gets into a position where he has a large profit, dreams of the even greater profits to come will often prompt him not to sell. Instead, he hangs on…and hangs on…until eventually the large profit turns into a loss.

Bob draws on his experiences in the military (he was a fighter pilot during the Vietnam War) and in casinos to illustrate some of the points he wants to make about investing. These personal reminiscences from outside the world of investing are colourful and relevant.

At around 120 pages the book is short, but at the same time it is long on practical information. It is a stream of investing common-sense interspersed with historical examples and personal experiences. I think it would be an enjoyable read even if you aren’t involved in the financial markets, but it should be an especially enjoyable and useful read for anyone who speculates in the shares of junior gold, silver and other natural-resource companies.

Print This Post Print This Post
Money management and the gold mining rally

May 21, 2016

This blog post is a modified excerpt from a TSI commentary published a week ago.

Among other things, good money management involves trading around a core position, with the core position being in synch with the long-term trend. In particular, during a strong intermediate-term rally it involves 1) maintaining core exposure in line with the long-term bull market and 2) methodically scaling back to core exposure as prices move sharply upward.

BOTH of the aforementioned tactics must be used to mitigate the risk of suffering a large loss AND the risk of suffering a large opportunity cost. For example, if you don’t sell anything during a strong rally then you are guaranteed to suffer a large loss once the inevitable ensuing decline occurs and you won’t have either the financial or the emotional capacity to take advantage of future buying opportunities. For another example, if you sell everything when you think that the market is close to a top then it will just be a matter of time before you find yourself on the sidelines with no exposure as prices move much higher than you ever thought possible.

In more general terms, good money management involves embracing the reality that while it is possible to measure — by looking at sentiment and momentum indicators — when a market is stretched to the upside or the downside, it is not possible to RELIABLY predict market tops and bottoms. It is not even possible to reliably identify important market tops and bottoms at the time they are happening. Fortunately, and contrary to what some self-styled gurus will tell you, achieving well-above-average long-term performance does not require the reliable prediction of tops and bottoms.

With regard to my own money management, this year’s rally in the gold-mining sector was the first rally in years that was strong enough to prompt scaling back all the way to ‘core’ (long-term) exposure. This entailed selling almost half of my total position.

I might do a small amount of additional selling if there’s another leg higher within the next few weeks, but I have built up as much cash as I want so my next big move will be on the buy side. However, I will not do any buying into extreme strength. I will, instead, wait as long as it takes for the market to reach a sufficiently depressed level, secure in the knowledge that my core exposure covers me against the possibility of ‘surprising’ additional short-term strength.

Print This Post Print This Post