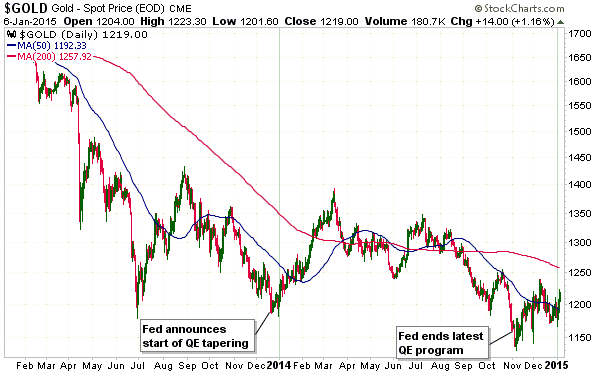
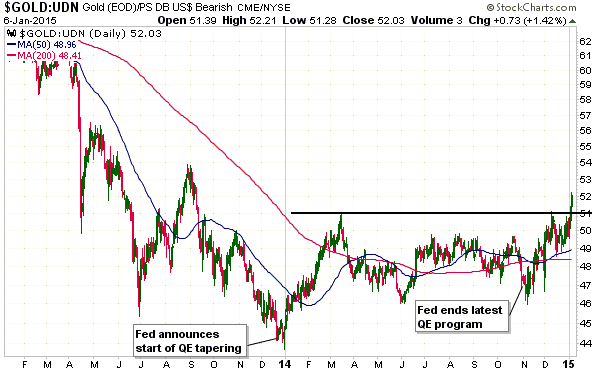
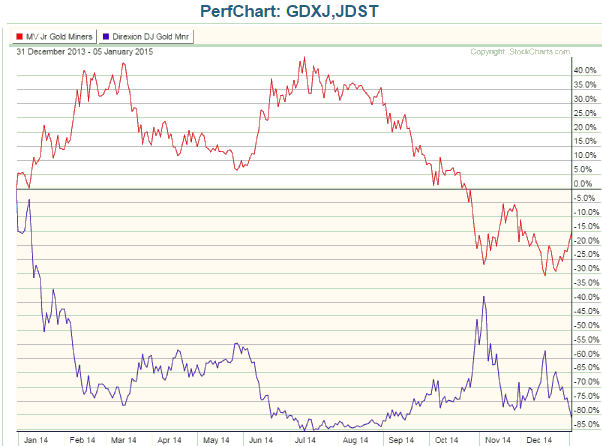
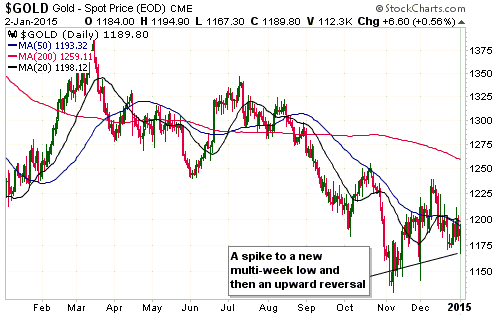
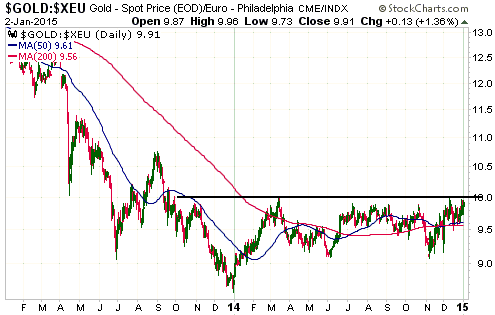
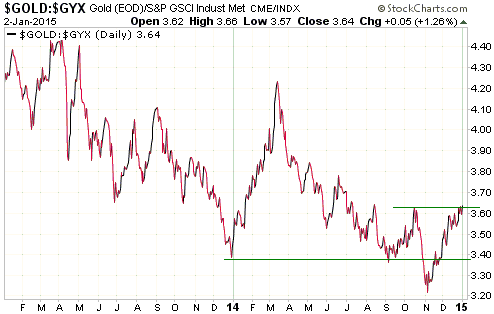
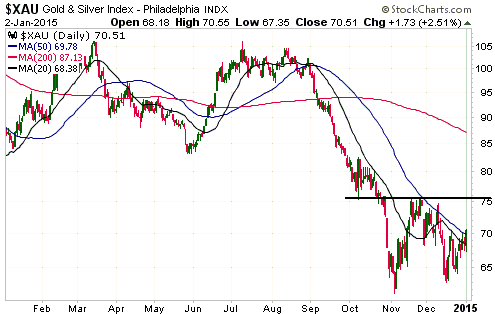
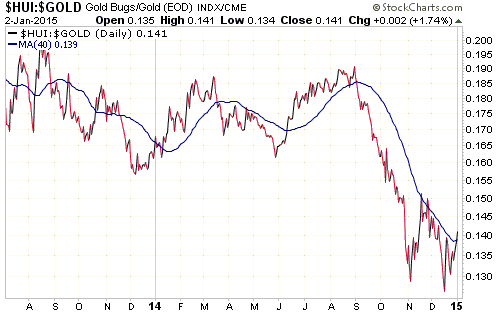
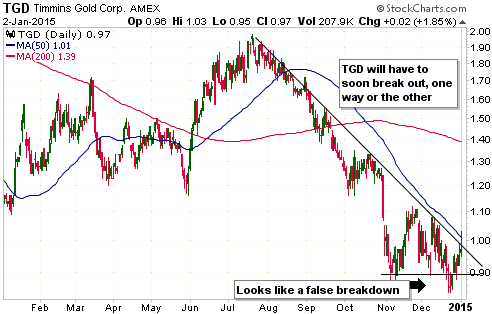
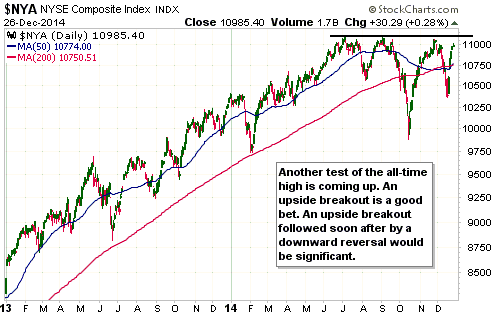
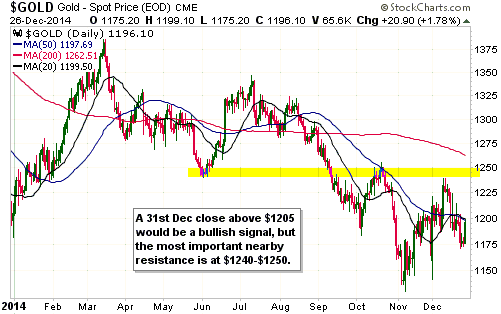
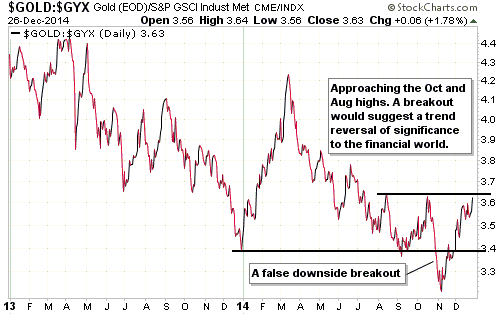
Here are the charts referenced in a Market Alert email just sent to TSI subscribers.
Right for the wrong reasons
It is not uncommon for people who make predictions about the financial markets to be right for the wrong reasons, meaning that even though their reasoning turned out to be wrong the market ended up doing roughly what was predicted. Here are two examples that explain what I’m talking about.
The first example involves the popular forecast, during 1995-2000, that the US stock market would continue to be propelled upward by a technology-driven productivity miracle. This reasoning was used by high-profile analysts such as Abby Joseph Cohen to explain why stratospheric valuations would go even higher. As long as the bull market remained intact these analysts were generally held in high regard, but their reasoning was terribly flawed.
Anyone with a basic understanding of good economic theory knows that increasing productivity causes prices to fall, not rise. Furthermore, while it is certainly possible for some individual companies to justifiably obtain higher market valuations by becoming more productive than their competitors, a general increase in productivity will not cause a sustained, economy-wide increase in corporate profitability and will not justify higher valuations for most equities. To put it another way, the main beneficiaries of higher productivity are consumers, not stock speculators and investors in equity-index funds. Consequently, there was never a possibility that rising productivity was behind the 1995-2000 surge in the US stock market. “Rising productivity” was just a story that sounded good to the masses while the market was going up.
Like all bull markets in major asset classes, the bull market in US equities that ended in 2000 was driven by the expansions of money and credit. After the pace of monetary expansion slowed, the bull market naturally collapsed.
The second example involves the forecast, in 2011-2012, that the gold price was destined to fall a long way due to deflation. Regardless of whether your preferred definitions of inflation and deflation revolve around money supply, credit supply, asset prices or consumer prices, there has been no deflation and plenty of inflation over the past 2-3 years, so advocates of the “gold is going to lose a lot of value due to deflation” forecast could not have been more wrong in their reasoning. However, the gold market has performed as predicted!
Rather than being a victim of deflation, gold was a victim of the reality that over the past three years a bout of rampant monetary inflation led to a huge rally in the broad stock market, which, in turn, boosted economic confidence. Ironically, had the reasoning of the “gold to fall due to deflation” group been close to the mark, the gold price would probably have experienced nothing more than a 12-18 month consolidation following its September-2011 peak. This is not because gold benefits from deflation (it doesn’t), but because the combination of economic weakness, declining economic confidence and the actions taken by central banks to address the economic weakness would have elevated the investment demand for gold.
I’ve noticed that fundamentals-based analysis is rarely questioned if it matches the price action and, by the same token, is often greeted with skepticism if it is in conflict with a well-established price trend. During a raging bull market even the silliest bullish analyses tend to be viewed as credible, and after a bear market has become ‘long in the tooth’ even a completely illogical or irrelevant piece of analysis will tend to be viewed as smart, or at least worthy of serious consideration, if its conclusion is bearish. However, from a practical investing perspective, fundamental analysis can be most useful when its conclusions are at odds with the current price trend. The reason is that the greatest opportunities for profit in the world of investing and long-term speculation are created by divergences between value and price.
Revisiting the Goldman Sachs $1050/oz gold forecast
This blog post is a slightly-modified excerpt from a recent TSI commentary.
At the beginning of this year, banking behemoth Goldman Sachs (GS) called for gold to end the year at around $1050/oz. I didn’t agree with this forecast at the time and still believe it to be an unlikely outcome (although less unlikely than it was a few months ago), but earlier this year I gave Goldman Sachs credit for at least looking in the right direction for clues as to what would happen to the gold price. In this respect the GS analysis was/is vastly superior to the analysis coming from many gold-bullish commentators.
Here’s what I wrote at TSI when dealing with this topic back in April:
“GS’s analysis is superior to that of many gold bulls because it is focused on a genuine fundamental driver. While many gold-bullish analysts kid themselves that they can measure changes in demand and predict prices by adding up trading volumes and comparing one volume (e.g. the amount of gold being imported by China) to another volume (e.g. the amount of gold being sold by the mining industry), the GS analysts are considering the likely future performance of the US economy.
The GS bearish argument goes like this: Real US economic growth will accelerate over the next few quarters, while interest rates rise and inflation expectations remain low. If this happens, gold’s bear market will continue.
The logic in the above paragraph is flawless. If real US economic growth actually does accelerate over the next few quarters then a bearish view on the US$ gold price will turn out to be correct, almost regardless of what happens elsewhere in the world. The reason the GS outlook is probably going to be wrong is that the premise is wrong. Specifically, the US economy is more likely to be moribund than strong over the next few quarters. It’s a good bet that inflation expectations will remain low throughout this year, but real yields offered by US Treasuries are more likely to decline than rise due to signs of economic weakness and an increase in the popularity of ‘safe havens’ as the stock market trends downward.”
I was right and GS was wrong about interest rates, in that both nominal and real US interest rates are lower today than they were in April. However, it is certainly fair to say that GS’s overall outlook as it pertains to the gold market has been closer to the mark than mine over the intervening period. This is primarily because economic confidence has risen, which is largely due to the continuing rise in the senior US stock indices.
So, regardless of whether or not gold ends up getting closer to GS’s $1050/oz target before year-end (I don’t think it will), I give GS credit for being mostly right for mostly the right reasons over the course of this year to date.
For their part, many gold bulls continue to look in the wrong direction for clues as to what the future holds in store. In particular, they continue to fixate on trading volumes, seemingly oblivious to the fact that for every net-buyer there is a net-seller and that the change in price is the only reliable indicator of whether the buyers or the sellers are the more motivated.
Something has changed
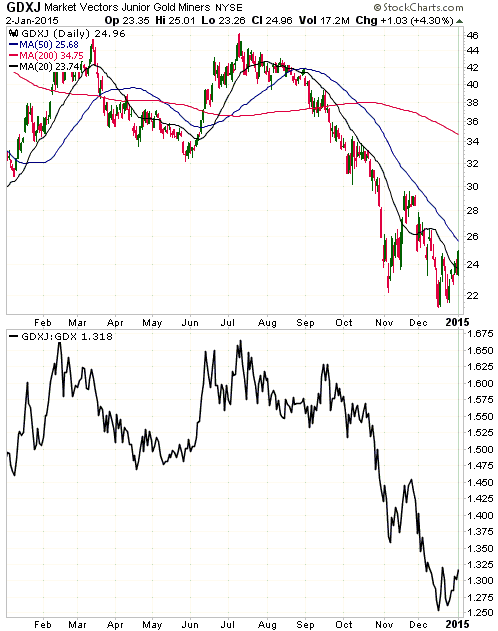
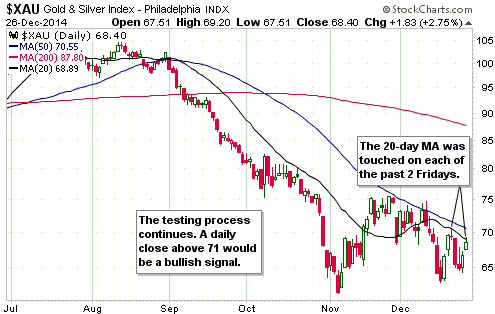
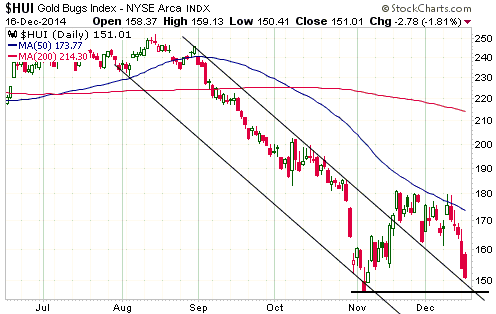
The gold-stock indices and ETFs are getting close to reasonable upside targets for the INITIAL rallies from their October-November crash lows. These targets are defined by resistance at 185-190 for the HUI and 77-80 for the XAU. For GDXJ, the upside target for the initial rally mentioned at TSI was $29, which has already been reached. Actually, the resistance that defines the most realistic initial rally target for GDXJ extends from $29 to $31.50.
The main purpose of this brief post is to point out that something has just happened that hasn’t happened since the first half of June. I’m referring to the fact that for the first time in more than 5 months, GDXJ has just achieved 3 consecutive up-days.
This is just another small piece of a big puzzle. It is evidence that the current rebound could evolve into something substantial.
Why GLD’s bullion inventory follows the gold price
The concept that must always be kept in mind when analysing changes in the amount of gold bullion held by the SPDR Gold Trust (GLD), the largest gold bullion ETF, is that these changes can only happen as a result of arbitrage. More specifically, the Authorised Participants (APs) in the ETF will only add gold to the inventory when an arbitrage opportunity is created by the price of a GLD share moving above the net asset value (NAV) of a GLD share and remove gold from the inventory when an arbitrage opportunity is created by the price of a GLD share moving below the NAV of a GLD share.
The addition of the gold involves multiple steps (the short-selling of GLD shares, the purchase of gold bullion, the delivering of gold bullion to the ETF and the creation of new GLD shares that are used to cover the aforementioned short position) that occur almost simultaneously, but the key is that it is a mechanistic process that a) gets initiated by GLD’s market price moving above its NAV and b) serves the purpose of closing the price-NAV gap. Similarly, there are multiple virtually-simultaneous steps involved in the removal of gold from GLD’s inventory (the buying of GLD shares, the short-selling of gold bullion, the redeeming of GLD shares for gold bullion from GLD’s inventory, and the use of the bullion obtained from the inventory to cover the aforementioned gold short position). And again, it is a mechanistic process that a) gets initiated by GLD’s market price moving below its NAV and b) serves the purpose of closing the price-NAV gap.
In the hope of adding clarity I’ll mention two related points.
First, it is not possible for GLD’s gold inventory to be used to cover short positions elsewhere in the gold market except as part of the arbitrage described above.
Second, because GLD holds gold bullion, a change in the price of gold will not necessitate a change in GLD’s inventory. GLD’s shares will naturally track the price of gold without the need to do anything, regardless of how far or how fast the price of gold moves.
That being said, there are times when the buyers of GLD shares become over-eager, causing the market price of GLD to rise relative to the price of gold, and there are times when the sellers of GLD shares become over-eager, causing the market price of GLD to fall relative to the price of gold. This sets in motion the arbitrage described above.
Now, buyers are most likely to become over-eager after the price has been trending higher for a while and sellers are most likely to become over-eager after the price has been trending lower for a while. That’s why the chart presented below shows that major trends in the GLD inventory FOLLOW major trends in the gold price, and why it makes more sense to view 2013′s large decline in GLD’s gold inventory as an effect, not a cause, of the large decline in the gold price.
Most gold market analysts don’t understand the most basic law of economics
I start reading a lot more articles about gold than I finish reading. This is because as soon as I read something in an article that reveals a very basic misunderstanding about the gold market, I stop reading. Sometimes I don’t even get past the first paragraph. Life is too short and there is so much to read that I refuse to waste time reading the words of someone who has just demonstrated cluelessness on the topic at hand. Here are some of the ‘red flag’ statements and arguments in a gold-related article that would stop me in my tracks.
1) Treating annual gold mine production as if it were a large part of the supply side of the equation.
In other metals markets it can make sense to treat new mine supply as if it were a proxy for total supply, but in the gold market the mining industry’s annual production is roughly equivalent to only 1.5% of total supply (see my earlier post on this topic). Therefore, as soon as an article starts comparing the amount of gold bought by a country or market segment with the mining industry’s annual production, as if the mining industry’s production was the main way in which gold demand could be satisfied, I stop reading.
2) Misunderstanding the relationship between supply, demand and price.
Many gold-market analyses are unwittingly based on the premise that the law of supply and demand doesn’t apply to gold. What I mean is that a lot of what passes for analysis in the gold market contains comments to the effect that the demand for physical gold rose relative to supply during a period even though the price fell during that period. I stop reading as soon as I see a comment along these lines. The author of the article may as well have held up a big sign that says: “You’re wasting your time reading this because I’m completely clueless”.
The falling price in parallel with rising demand scenario favoured by too many gold-market commentators is absolutely, unequivocally, impossible. If demand is attempting to rise relative to supply, then the price MUST rise. Note that I say “attempting” to rise, because, in a market that is able to clear (such as the gold market), supply and demand will always be the same, with the price changing to whatever it needs to be to maintain the balance. Furthermore, the change in price is the only way to tell whether demand is attempting to rise relative to supply or whether supply is attempting to rise relative to demand. If the price falls over a period then it is an irrefutable fact that demand attempted to fall relative to supply during that period.
On a related matter, many people fall into the trap of confusing trading volume with demand. However, trading volume generally doesn’t imply anything about demand or price.
A change in volume is never an explanation for a price change and is never an indication of whether demand is attempting to rise or fall relative to supply. The reason is that every transaction involves an increase in demand on the part of the buyer and an exactly offsetting decrease in demand on the part of the seller.
3) The selling of “paper gold” explains how the price of physical gold can fall in parallel with surging demand for physical gold.
No, it doesn’t; an increase in the demand for physical gold cannot be satisfied by an increase in the supply of “paper gold”. Regardless of what is happening in the so-called “paper” markets (e.g., the futures market), if the demand for physical gold attempts to rise relative to the supply of physical gold then the price of physical gold will rise to maintain the balance.
Now, you could reasonably argue that the goings-on in the “paper” markets affect the physical market in such a way that the holders of physical gold offer their gold for sale at lower prices than would otherwise have been the case, but this is very different from arguing that the price fell while demand increased relative to supply. For anyone who cares about logic and who understands the most basic law of economics, the latter argument is nonsense.
4) Adding up the flows of gold between different geographic regions or between different parts of the market as if the resultant information could explain past price movements and predict future price movements.
This is a corollary to item 2). It involves making the mistake of treating trading volume as a fundamental driver of price. In popular gold market analyses, this mistake most often manifests itself as treating the flow of gold into China as if it were a hugely bullish fundamental.
Think of the gold world as containing only two traders called China and World-Excluding-China (WEC). If WEC becomes a net seller of gold, then China must become a net buyer of gold to the same extent. The question is: How far will the price have to fall before China is prepared to buy all the gold that WEC wants to sell or WEC’s desire to sell is sufficiently reduced to restore balance? By the same token, if WEC becomes a net buyer of gold, then China must become a net seller of gold to the same extent. The question then becomes: How far will the price have to rise before China is prepared to sell all the gold that WEC wants to buy or WEC’s desire to buy is sufficiently reduced to restore balance?
The answers to such questions are never known ahead of time. In any case, the point is that flows of gold from one part of the world to another convey little or no information about price, so why do so many gold-market analysts fixate on them?
5) Presenting intra-day price charts showing sharp ‘inexplicable’ declines to make the case that the gold price is being manipulated downward.
This counts as misinformation by omission, as even during a downward trend there will be roughly as many sudden and ‘inexplicable’ intra-day price rises as there are price declines. This has been demonstrated by “Kid Dynamite” HERE and in the related articles at the bottom of the linked post. (Note: In case it isn’t obvious, Kid Dynamite is not attempting to show that the gold price is being manipulated upward. With tongue firmly planted in cheek, he is attempting to show that similar ‘evidence’ used to support the downward manipulation case can be used to support an upward manipulation case.)
You should ask yourself why some bloggers and newsletter writers only show you the intra-day downward spikes. Are they unaware of the upward spikes, or are they trying to mislead you?
A hated sector with asymmetric return potential
I was just sent THIS LINK (thanks Richard) to a very interesting article. Actually, the entire web site (Capitalist Exploits) looks like it would be worth exploring, but at this stage I’ve only read the one article.
The article shows the average annual 3-year returns from a bombed-out sector, industry and country. For example, it points out that stock-market sectors that have fallen by 80% from their highs have, on average, achieved a nominal return of 172% per year over the ensuing 3 years.
With GDXJ having suffered a peak-to-trough shellacking of 87%, this has relevance to the gold-mining sector.
The gold sector’s 2-3 year risk/reward is phenomenally attractive, regardless of whether or not gold’s long-term bull market is intact. However, it would be unwise to attempt to take advantage of this exceptional intermediate-to-long-term profit potential via leveraged ETFs. I explained why in a previous post.
First-hand impressions of the “Umbrella Movement”
I went to Hong Kong last weekend to get a first-hand look at the protests that are now commonly referred to as the “Umbrella Movement”. I went there believing that the protest movement had very little chance of achieving its main objective, which is to gain a ‘free and fair’ election process for Hong Kong, and came away with the same opinion.
The current protests are taking place in three parts of HK — in the streets around the central government offices in Admiralty (near Central on Hong Kong Island), along part of Nathan Road in Mong Kok (a major shopping area on the Kowloon side of HK), and Causeway Bay (a popular shopping/tourist area on Hong Kong Island). Protestors have blocked off some main streets using makeshift barricades and set up camp.
This must be one of the most peaceful mass protests ever. There are thousands of tents on the streets in the protest areas, but apart from numerous signs demanding “civil nomination” for political office and a few people giving speeches to small crowds at night-time, it doesn’t even seem like a protest. Rather, it seems as if a tent-dwelling community decided to make a home in the middle of a bustling metropolis. There are first-aid tents, covered study areas with many desks so that the students participating in the protest can keep up with their schoolwork, food and drink distribution points, and basic toilet/shower facilities. Also, the occupied areas are kept clean and tidy (there is no rubbish lying around). There was a police presence at Mong Kok (a few dozen uniformed police men and women were standing around the outside of the protest area looking bored), but not at Admiralty.
Here are some of the photos I took.
These photos show the tent cities:
These photos show what is now known as “Lennon Wall”. The wall is part of an elevated road in Admiralty and is coated with countless thousands of messages of support.
Finally, these photos show a first-aid tent, two covered study areas, and examples of the protestors’ artwork:
Overall, it appears to be business as usual in HK. Most people are going about their daily lives as if nothing out of the ordinary is going on, and Hong Kong has adjusted to having no vehicular access to the parts of the city occupied by the protestors. However, the situation could turn ugly, as it did for a few days in September, if the government makes another attempt to forcibly remove the protestors.
Although I couldn’t gauge the general level of support for the protest movement within the HK population, I suspect that most HK residents do not want to ‘rock the boat’ for the sake of greater political freedom. Furthermore, there is clearly some animosity towards the protestors on the part of HK people whose businesses have been disrupted by having some main streets blocked off. In one case, this animosity took the form of a high-volume tirade from a taxi driver when he was asked by my wife for his opinion about the protests.
Hong Kong’s rapidly-rising cost of living is one of the root causes of the discontent that led to the mass protests, but this problem would almost certainly not be addressed by ‘the people’ gaining more influence over who occupies the top political offices. The reason is that hardly anyone involved in the protest movement understands that the high cost of living is due to HK being crushed between the inflationary policies of the US and China.
Thanks to the HK dollar’s peg to the US dollar, HK’s monetary authority essentially follows the US Federal Reserve. This means that despite the steep upward trend in HK prices, interest rates are still being held near zero and the money supply is still being inflated at a brisk pace (it is up by 15% over the past 12 months). At the same time, as a result of the appreciation of the Yuan relative to the US$ and the large price rises in China’s major cities courtesy of rampant monetary inflation in that country, prices in HK still appear reasonable to the mainland Chinese who continue to flood into HK to spend money.
Hong Kong’s “inflation” problem looks destined to get worse over the coming 12 months, which could lead to more widespread support for the “Umbrella Movement”. But in the absence of a general understanding of the nature of the problem, taking a step in the direction of democracy is not going to help.
Anticipating the end of the gold-stock crash
The gold mining sector entered crash mode last Wednesday (29th October). These types of events typically last 5-6 trading days, although they are sometimes a little shorter and sometimes a little longer. Based on the typical length of a multi-day crash the most likely time for a low is therefore this Tuesday (day 5) or Wednesday (day 6).
It is not uncommon for a multi-day crash to be interrupted by one ‘up day’. For example, a 6-day crash could entail three down days followed by an up day and then two more down days to complete the decline. Monday’s bounce in the gold-mining indices and ETFs is therefore not evidence that the crash is over. However, another advance of at least a few percent on Tuesday 4th November would be evidence that the crash is over.
Incredibly, both the Central Fund of Canada (CEF) and the Central Gold Trust (GTU) are now trading at discounts to their net asset values of almost 10%. This means that purchasing CEF near its current price is roughly equivalent to paying $1050/oz for gold and $14.50/oz for silver. The unusually large discounts at which these bullion funds are now trading is an indication that gold and silver are almost as out-of-favour as they ever get.
Why leveraged ETFs should only ever be used for short-term trades
This topic was recently revisited at TSI due to the growing popularity of ETFs that are designed to move each day by 2 or 3 times the amount of a target index. My main point was/is that leveraged ETFs should only ever be used as short-term trading vehicles, because they tend to leak value over time. This is not a design flaw; it’s just something that anyone who trades these ETFs should be well aware of. Here is a slightly modified version of the most recent TSI coverage of the issue.
The crux of the matter is that leveraged ETFs are designed to move by 2 or 3 times the DAILY percentage changes of the target indexes. They are NOT designed to move by 2 or 3 times the percentage change of the target indexes over periods of longer than one day. Due to the effects of compounding, their percentage changes over periods of much longer than one day will usually be less — and sometimes substantially less — than 2-times (in the case of a 2X ETF) or 3-times (in the case of a 3X ETF) the percentage changes in the target indexes. For example, if you believe that the S&P500 Index is going to fall by 30% over the coming 12 months and to profit from this expected decline you purchase SDS, an ETF designed to move each day by 2-times the inverse of the SPX’s percentage change, then you will probably not make a 60% profit on this trade even if you turn out to be totally correct about the SPX’s performance. Instead, the amount of profit you make will be determined by the path taken by the SPX on its way to the 30% loss and will probably be a lot less than 60%.
The easiest way for me to explain how the relationship between the daily percentage change of an index and the daily percentage change of an associated leveraged ETF does not translate into a similar relationship over periods of longer than one day, is via some hypothetical examples that show how the math works. Here I go.
In the tables presented below, Index A is the target index (the index for which leveraged exposure is created) and 100 is the starting (Day 0) value for both the index and the associated leveraged ETF. I then move the index up on one day and down by the same amount on the next day, such that by Day 6 it is still at 100.
In the first table, Index A alternately moves up by 10 points and down by 10 points, ending Day 6 back where it started (at 100). The final column in this table shows the value of an ETF designed to move each day by twice the percentage change of Index A. Even though Index A ended the 6-day period unchanged, the 2X ETF based on Index A ended the period with a loss of 5.4%.
Index A $ Value | Index A $ change | Index A % change | 2X ETF % change | 2X ETF $ Value | |
Day 0 | 100.0 | 0.0 | 0.0 | 0.0 | 100.0 |
Day 1 | 110.0 | 10.0 | 10.0 | 20.0 | 120.0 |
Day 2 | 100.0 | -10.0 | -9.1 | -18.2 | 98.2 |
Day 3 | 110.0 | 10.0 | 10.0 | 20.0 | 117.8 |
Day 4 | 100.0 | -10.0 | -9.1 | -18.2 | 96.4 |
Day 5 | 110.0 | 10.0 | 10.0 | 20.0 | 115.7 |
Day 6 | 100.0 | -10.0 | -9.1 | -18.2 | 94.6 |
In the second table the volatility is ramped up. Instead of Index A alternately moving up and down by 10 points it experiences 20-point daily swings, but still ends Day 6 back where it started (at 100). Even though Index A ended the 6-day period unchanged, in this case the 2X ETF based on Index A ended the period with a loss of 18.7%.
Index A $ Value | Index A $ change | Index A % change | 2X ETF % change | 2X ETF $ Value | |
Day 0 | 100.0 | 0.0 | 0.0 | 0.0 | 100.0 |
Day 1 | 120.0 | 20.0 | 20.0 | 40.0 | 140.0 |
Day 2 | 100.0 | -20.0 | -16.7 | -33.3 | 93.3 |
Day 3 | 120.0 | 20.0 | 20.0 | 40.0 | 130.7 |
Day 4 | 100.0 | -20.0 | -16.7 | -33.3 | 87.1 |
Day 5 | 120.0 | 20.0 | 20.0 | 40.0 | 122.0 |
Day 6 | 100.0 | -20.0 | -16.7 | -33.3 | 81.3 |
In the third and final table I go back to the 10-point daily swings, but change the leverage to 3-times. In this case, the unchanged result for the index was accompanied by a loss of 15.5% for the leveraged ETF.
Index A $ Value | Index A $ change | Index A % change | 3X ETF % change | 3X ETF $ Value | |
Day 0 | 100.0 | 0.0 | 0.0 | 0.0 | 100.0 |
Day 1 | 110.0 | 10.0 | 10.0 | 30.0 | 130.0 |
Day 2 | 100.0 | -10.0 | -9.1 | -27.3 | 94.5 |
Day 3 | 110.0 | 10.0 | 10.0 | 30.0 | 122.9 |
Day 4 | 100.0 | -10.0 | -9.1 | -27.3 | 89.4 |
Day 5 | 110.0 | 10.0 | 10.0 | 30.0 | 116.2 |
Day 6 | 100.0 | -10.0 | -9.1 | -27.3 | 84.5 |
An implication of the above is that the greater the volatility of an index and the greater the leverage provided by an ETF linked to the index, the worse the likely performance of the leveraged ETF over extended periods. The worse, that is, relative to the performance superficially implied by the daily percentage change relationship between the index and the leveraged ETF. So, it is fair to say that leveraged ETFs are only suitable for short-term trades and that a trade should be very short-term if it involves a 3X ETF and/or a volatile market.
My final point is that it is possible to take advantage of the value leakage inherent in the design of leveraged ETFs by shorting them rather than buying them. For example, if you want to use a leveraged ETF to profit from an expected decline in the S&P500 Index, you will generally be better served by going short SSO (ProShares Ultra Long S&P500 Fund) than by going long SDS (ProShares Ultra Short S&P500 Fund). For another example, if you want to use a leveraged ETF to profit from an expected rise in junior gold-mining stocks and you plan to hold the position for more than a few weeks, you will generally be better served by going short JDST (Junior Gold Miners Index Bear 3X) than by going long JNUG (Junior Gold Miners Index Bull 3X).