The Mythical Silver Shortage

September 24, 2015

This post is an excerpt from a recent TSI commentary.

Excited talk of a silver shortage has made its annual reappearance. This talk is always based on anecdotal evidence of silver coins or small bars being difficult to obtain in some parts of the world via retail coin dealers. It never has anything to do with the overall supply situation.

Shortages of silver and gold in certain manufactured forms favoured by the public will periodically arise, often because of a sudden and unanticipated (by the mints) increase in the public’s demand for these items. Furthermore, the increase in the public’s demand is often a reaction to a sharp price decline, the reason being that in the immediate aftermath of a sharp price decline the metals will look cheap regardless of whether they are actually cheap based on the fundamental drivers of value.

These periodic shortages of bullion in some of the manufactured forms favoured by the public are not important considerations when assessing future price potential. The main reason is that the total volume of metal purchased by the public in such forms is a veritable drop in the market ocean. For example, the total worldwide volume of silver in coin form purchased by the public in a YEAR is less than the amount of silver that changes hands via the LBMA in an average trading DAY.

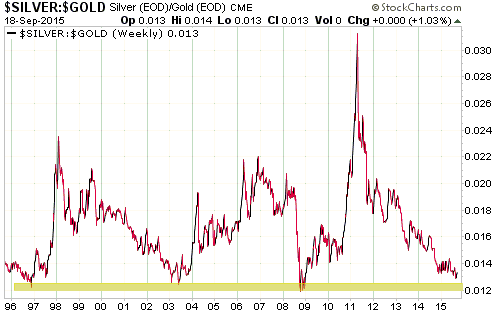
If gold continues to rally over the weeks ahead then silver will also rally. By the same token, if gold doesn’t rally over the weeks ahead then neither will silver. In other words, regardless of any anecdotal evidence of silver shortages at coin shops, silver’s short-term price trend will be determined by gold’s short-term price trend. Furthermore, if the gold price rises then the silver price will probably rise by a greater percentage, the reason being that the silver/gold ratio is close to a multi-decade low (implying: silver is very cheap relative to gold).

A final point worth making on this topic is that the claims of silver or gold shortages that periodically spring-up are not only misguided, they are dangerous. This relates to the fact that the most popular argument against gold and silver recapturing their monetary roles is that there isn’t enough of the stuff to go around. The gold and silver enthusiasts who cry “major shortage!” whenever it temporarily becomes difficult to buy coins from the local shop are therefore effectively supporting the case AGAINST the future use of gold and silver as money. You see, a critical characteristic of money is that obtaining it is always solely a question of price.

Print This Post Print This Post

Charts of interest

September 23, 2015

Comments on the following charts will be emailed to TSI subscribers.

1) Gold

gold_blog_220915

2) The HUI

HUI_blog_220915

3) The Dollar Index

US$_blog_220915

4) The S&P500 Index (SPX)

SPX_blog_220915


Print This Post Print This Post
Updated thoughts on BitGold/Goldmoney

September 21, 2015

I last wrote about BitGold (XAU.V), which is now called Goldmoney, most recently in a blog post on 26th May. In the linked post I expanded on my view that the company had a great product from the perspective of customers, but a very over-priced stock. I concluded that at some unknowable future time the “it’s a great product with smart management therefore the stock should be bought at any price” bubble of enthusiasm would collide with the “it will always be a low-margin business and therefore deserves a low valuation” brick wall of reality. Although the stock price has since dropped about 20%, the valuation of the stock still appears to be extremely high considering the profit-generating potential of the underlying business. It is therefore fair to say that the bubble of enthusiasm hasn’t yet collided with the brick wall of reality.

Every month, Goldmoney reports what it calls “Key Performance Indicators” (KPIs) of its business. These KPIs seem impressive at first glance and seem to justify the stock’s market capitalisation. For example, the company reported that at the end of August it had C$1.5B of customer assets under management (AUM), an amount that is several times greater than its current market cap of C$235M (55M shares at C$4.27/share). However, unlike a mutual fund that charges a fee based on AUM, Goldmoney charges nothing to store its customers’ assets (gold bullion). This means that the larger the amount of Goldmoney’s AUM, the greater the net COST to the owners of the business (Goldmoney’s shareholders).

This is an important point. Based on Goldmoney’s current fee structure, it will always lose money on customers who use the service primarily for store-of-value purposes. Under the current monetary system this is where PayPal has a big advantage over Goldmoney. Nobody views their PayPal account as a long-term store of value, but many of Goldmoney’s customers view the service as a convenient way to store their physical gold. They don’t want to spend their gold, they want to save it.

Another KPI that looks impressive at first glance is “Transaction Volume”. For example, the company reported total transaction volume of C$47M for August. However, not all transactions attract fees and for the ones that do the fee is 1%. This means that the revenue to Goldmoney will always be less than 1% of the total transaction volume.

What’s important in assessing the stock’s valuation is the revenue to Goldmoney relative to its costs. This information is not presented in the company’s monthly KPI reports, but it is presented in the quarterly financial statements. Unfortunately, the latest quarterly statements aren’t useful because a major acquisition happened after the 30th June cutoff date. The next quarterly statements will be more informative, but we probably won’t get a good indication of Goldmoney’s real financial performance and earning potential until the December-quarter results are published early next year.

At this stage I don’t have enough information to value Goldmoney, although I suspect that ‘reasonable value’ is a long way below the current price. I’ll post some updated thoughts when I have a clearer view of what the stock is worth, which might not be until February next year. In the meantime I’ll stay away. I have no desire to own the stock and, despite the apparent valuation-related downside risk, no desire to short the stock.

Print This Post Print This Post
The S&P500 is coiling ahead of the Fed’s decision

September 16, 2015

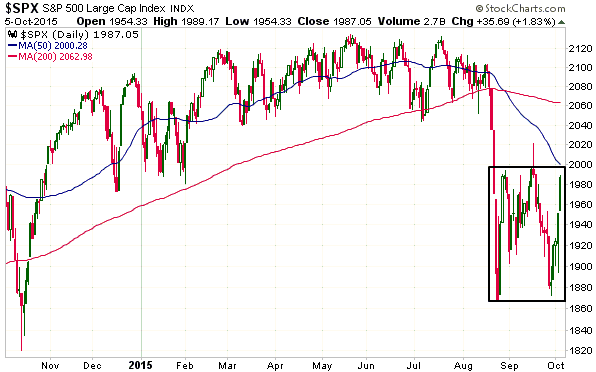
I’ve placed a small bet (via put options) that the senior US stock indices will drop to test their 24th August lows by mid-October. At the same time I acknowledge the potential for a sharp move to the upside over the next 2-3 days in anticipation of and in reaction to the Fed’s 17th September interest-rate decision. That’s why my bearish bet is small.

The chart pattern of the S&P500 Index (SPX) suggests that there will be a sharp move over the days immediately ahead, although it doesn’t point to a particular direction. One possible outcome involves an upside breakout within the next two days from the contracting triangle drawn on the following chart and then a downward reversal. This is the near-term outcome that would confuse the greatest number of traders, which is why I favour it.

SPX_blog_160915

I never risk money on guesses about what any financial market is going to do over time periods as short as a few days, but it’s still fun to guess.

Print This Post Print This Post
Economic busts are not caused by policy mistakes

September 14, 2015

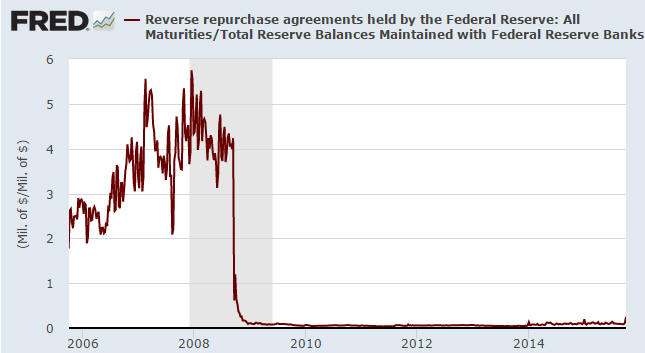
What I mean by the title of this post is that the central-bank tightening that almost always precedes an economic bust is never the cause of the bust. However, it’s a fact that economic busts are indirectly caused by policy mistakes, in that policy mistakes lead to artificial, credit-fueled booms. Once such a boom has been fostered, an ensuing and painful economic bust becomes unavoidable. The only question is: will the bust be short and sharp (the result if government and its agents stay out of the way) or drag on for more than a decade (the result if the government and its agents try to boost “aggregate demand”)?

The most commonly cited historical case of a policy mistake directly causing an economic bust is the Fed’s gentle tap on the monetary brake in 1937. This ‘tap’ was quickly followed by the resumption of the Great Depression, leading to the superficial conclusion that the 1937-1938 collapse in economic activity would never have happened if only the Fed had remained accommodative.

Let’s now take a look at what actually happened in 1937-1938 that could have caused the economic recovery of 1933-1936 to rapidly and completely disintegrate.

First, while commercial bank assets temporarily stopped growing in 1937, they didn’t contract. Commercial bank assets essentially flat-lined during 1937-1938 before resuming their upward trend in 1939.

Second, outstanding loans by US commercial banks were roughly the same in 1938 as they had been in 1936, so there was no widespread calling-in of existing loans. That is, there was no commercial-bank credit contraction to blame for the economic contraction.

Third, the volume of money held by the public was higher in 1937 than in 1936 and was roughly the same in 1938 as in 1937.

Fourth, M1 and M2 money supplies were roughly unchanged over 1937-1938, so there was no monetary contraction.

Fifth, the consolidated balance sheet of the Federal Reserve system was slightly larger in 1937 than in 1936 and significantly larger in 1938 than in 1937, so there was no genuine tightening of monetary conditions by the Fed at the time.

Sixth, an upward trend in commercial bank reserves that began in 1934 continued during 1937-1938.

Seventh, there were no increases in the interest rates set by the Fed during 1937-1938. In fact, there was a small CUT in the FRBNY’s discount rate in late-1937.

What, then, did the Fed do that supposedly caused one of the steepest economic downturns in US history? The answer is that it boosted commercial-bank reserve requirements.

All of which prompts the question: How did a 1937 increase in reserve requirements that didn’t even lead to a monetary or credit contraction possibly cause manufacturing activity to collapse and unemployment to skyrocket?

It’s a trick question, because the increase in reserve requirements clearly didn’t cause any such thing. The economic collapse of 1937-1938 happened because the recovery of 1933-1936 was not genuine, but was, instead, an artifact of increased government spending and other attempts to prop-up prices. The economy had never been permitted to fully eliminate the imbalances that arose during the late-1920s, so a return to the worst levels of the early-1930s was inevitable.

Many analysts are now worrying out loud that the Fed will repeat the so-called “mistake of 1937″, but the real problem is that the Fed and the government repeated the policy mistakes of the late-1920s and then repeated the policy mistakes of 1930-1936. The damage has been done and another economic bust is now unavoidable, regardless of what the Fed decides at this week’s meeting.

Print This Post Print This Post
Gold’s true fundamentals are mixed, at best

September 11, 2015

To paraphrase Jim Grant, gold’s perceived value in US$ terms is the reciprocal of confidence in the Fed and/or the US economy. That’s why the things I refer to as gold’s true fundamentals are measures of confidence in the Fed and/or the US economy. I’ve been covering these fundamental drivers of the gold price in TSI commentaries for about 15 years.

Note that I use the word “true” to distinguish the actual fundamental drivers of the gold price from the drivers that are regularly cited by the majority of gold-market analysts and commentators. According to many pontificators, gold’s fundamentals include the volume of gold being imported by China, the volume of gold being transferred out of the Shanghai Futures Exchange inventory, the amount of “registered” gold at the COMEX, India’s monsoon and wedding seasons, the amount of gold being bought/sold by various central banks, changes in mine production and scrap supply, and wild guesses regarding JP Morgan’s exposure to gold. These aren’t true fundamental price drivers. At best, they are distractions.

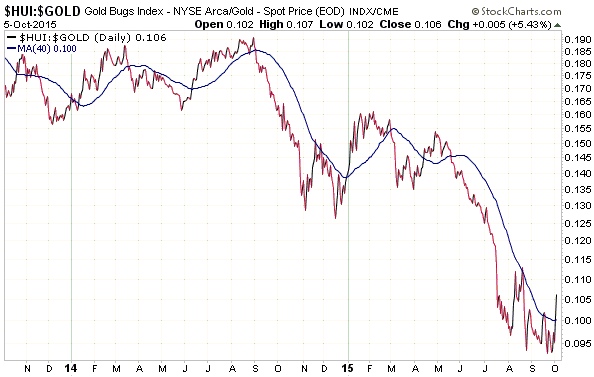
In no particular order, the gold market’s five most important fundamental drivers are the real interest rate, the yield curve, credit spreads, the relative strength of the banking sector, and the US dollar’s exchange rate.

Over the past 2 years gold’s true fundamentals have usually been mixed, meaning neither clearly bullish nor clearly bearish. What has tended to happen during this period is that when one of the fundamentals has moved decisively in one direction it has been counteracted by a move in the opposite direction by one of the others. For example, when credit spreads began to widen (gold-bullish) in mid-2014, the flattening of the yield curve (gold-bearish) accelerated. For another example, when the yield curve reversed direction and began to steepen (gold-bullish) in January of this year, the real interest rate turned upward (gold-bearish) and the banking sector began to strengthen relative to the broad stock market (gold-bearish).

Charts illustrating the performances over the past 5 years of the first four of the above-mentioned fundamental drivers of the gold market are displayed below. The first chart shows that the 10-year TIPS yield, a proxy for the real US interest rate, made a 2-year low in April of this year but has since moved to a 1-year high and into the top third of its 2-year range. This is bearish for gold. The second chart shows that a proxy for US credit spreads has been working its way upward since mid-2014 and recently broke to a new 2-year high. This is bullish for gold. The third chart shows that the US yield curve began to steepen in January, which is bullish for gold, but its performance over the past two months casts doubt as to this driver’s current message. And the fourth chart shows that after being relatively weak from July-2013 through to January-2015, the bank sector suddenly became relatively strong early this year. This driver has therefore shifted from gold-bullish to gold-bearish.

The overall picture painted by these charts is that gold’s fundamentals are still mixed, although there is perhaps a slight bearish skew due to the new 12-month high in the real interest rate. I’m anticipating a shift towards a more gold-bullish fundamental backdrop, but it hasn’t happened yet.

TIPS_100915

creditspread_100915

yieldcurve_100915

BKX_SPX_100915

Print This Post Print This Post
Money need not be anything in particular

September 9, 2015

This post was inspired by an exchange between Martin Armstrong of Armstrong Economics and one of his readers. In an earlier blog entry Mr. Armstrong wrote: “The wealth of a nation is the total productivity of its people. If I have gold and want you to fix my house, I give you the gold for your labor. Thus, your wealth is your labor, and the gold is merely a medium of exchange. So it does not matter whatever the medium of exchange might be.” One of his readers took exception to this comment and argued that money should be tangible and ideally should be gold or silver.

Mr. Armstrong’s reply is worth reading in full. After giving us an abbreviated history of money through the ages, he sums up as follows:

Paper money is the medium of exchange between two people where one offers a service or something they manufactured, which is no different than a gold or silver coin requiring CONFIDENCE and an agreed value at that moment of exchange. You can no more eat paper money to survive than you can gold or silver. All require CONFIDENCE of a third party accepting it in exchange. For the medium of exchange to be truly TANGIBLE it must have a practical utilitarian value and that historically is the distinction of a barter system vs. post-Bronze Age REPRESENTATIVE/INTANGIBLE based monetary systems predicated upon CONFIDENCE.

I agree with Mr. Armstrong’s central point. Many gold advocates assert that gold is “real wealth” and has intrinsic value, which is patently wrong. Value is subjective and will change based on circumstances. For example, you might place a high value on gold in your current circumstances, but if you were stranded alone on an island with no hope of rescue then gold would probably have no value to you. Gold has exactly the same intrinsic value as a Federal Reserve note: zero.

However, he is very wrong when he states: “…it does not matter whatever the medium of exchange might be.” On the contrary, it matters more than almost anything in economics!

The problem with today’s monetary system isn’t that the general medium of exchange (money) has no intrinsic value. As noted above, money also had no intrinsic value when it was gold. The problem with today’s monetary system is that an unholy alliance of banks and government has near-total control of money. Banks have the power to create new money at whim, as does the government via the central bank.

Aside from the comparatively minor problem of causing the purchasing power of money to erode over time, the creation of money out of nothing by commercial banks and central banks distorts the relative-price signals that guide investment. This happens because the money enters the economy in a non-uniform way. In the US over the past several years, for example, most new money entered the economy via Primary Dealers who used it to purchase financial assets from other large speculators. The stock and bond markets were therefore the first and biggest beneficiaries of the new money, which led to an abnormally-large proportion of investment being directed towards strategies designed to profit from rising equity prices and low/falling interest rates. Such investment generally doesn’t add anything to the productive capacity of the economy. In fact, it often results in capital consumption.

Instead of saying “it does not matter whatever the medium of exchange might be”, what Mr. Armstrong should have said was: it does not matter whatever the medium of exchange might be, as long as it is chosen by the free market. Putting it another way, the government should stay out of the money business.

Print This Post Print This Post

The right way to think about gold supply

September 4, 2015

Here’s the wrong way to think about gold supply: “Although gold’s aboveground inventory is huge compared to current production, only a tiny fraction of this gold will usually be available for sale near the current price. Therefore, changes in mine supply can be important influences on the gold price.” I’ll now explain the right way to think about gold supply.

Whenever I point out that the supply side of the gold market consists of the entire aboveground gold inventory, which is probably somewhere between 150K tonnes and 200K tonnes, and that the gold-mining industry does no more than add about 1.5%/year to this inventory, an objection I often get is that only a tiny fraction of the aboveground inventory is available for sale at any time. This is of course true, and nobody who has a correct understanding of gold supply has ever claimed otherwise.

If all, or even most, of the aboveground supply were for sale at the current price then the price would not be able to rise. The price can rise and fall by substantial amounts, however, because there is always a huge range of prices at which the owners of the aboveground supply are prepared to sell. Moreover, this range is constantly changing based on changing personal circumstances and assessments of the market. In addition, some holders of existing aboveground gold will be planning to hold forever. These plans, which are themselves subject to change in response to changing circumstances, also factor into the formation of the gold price, in that a decision to withhold X ounces of supply can have a similar effect to a decision to buy X ounces.

As I write, gold is trading in the $1120s. It is therefore certain that a tiny fraction of the aboveground supply is currently changing hands in the $1120s and that there are plans in place to sell other tiny fractions in the $1130s, the $1140s, the $1150s, and all the way up to some extremely high number. Some people will also have plans to sell gold if the gold price falls below a particular level and there will be millions of people who have no specific selling intentions who will decide to sell in the future for some currently unforeseeable reason. At the same time there will be countless plans in place to buy at certain levels and millions of people with no present intention to buy who will, for reasons that aren’t currently foreseeable, decide to buy in the future.

It is the combination of these myriad plans that determines the price. Furthermore and as mentioned above, over the days ahead many of these plans will change. For example, some gold-buying/selling intentions will change based on what happens to the stock market or the bond market.

How does the gold-mining industry fit into the situation?

The gold-mining industry is not materially different from any other seller except that its plans are not price sensitive. Specifically, every year it will sell an amount that’s equivalent to about 1.5% of the total aboveground supply regardless of price. At this time four years ago it was selling gold in the $1800s and it is now selling roughly the same amount of gold in the $1100s. It is the ultimate price-taker. To put it another way: whatever price arises from the changing plans of gold owners and potential owners, that’s the price at which gold producers will sell.

On a related matter, due to the huge existing aboveground supply of gold there should never be a genuine shortage of physical gold. Obtaining more gold should always be solely a question price. A consequence is that the gold market should never go into “backwardation”, that is, the spot gold price should always be lower than the price for future delivery. Just to be clear: in an abundantly-supplied commodity market the futures price should be higher than the spot price by enough to eliminate the risk-free profit that could otherwise be had by selling the physical and buying the futures. That’s why it would be very significant if the gold market were to make a sustained and sizeable move into backwardation. Such a development would indicate that holders of the aboveground supply were withdrawing their gold from the market en masse and/or that the gold futures market was breaking down due a collapse in trust. Even the small and brief backwardations of the past two years have some significance*, although recent gold backwardation episodes have more to do with near-zero short-term US$ interest rates than gold supply/demand. The point is that gold backwardation is only important because the existing aboveground supply in saleable form dwarfs the rate of annual production.

In summary, the price of gold is where it is because of the range of prices at which existing holders intend to become sellers and the concurrent range of prices at which potential future holders intend to become buyers. These ranges are constantly in flux due to changing perceptions and circumstances.

*Keith Weiner has written extensively about the significance of gold backwardation at https://monetary-metals.com/.

Print This Post Print This Post

Quick 10% declines aren’t extraordinary

September 1, 2015

Here is an excerpt from a commentary posted at TSI on 30th August:

During bull-market years and bear-market years, it is not uncommon for the US stock market to experience a quick decline of 10% or more at some point. For example, there was at least one quick decline of 10% or more in 1994, 1996, 1997, 1998, 1999, 2000, 2001, 2002, 2003, 2007, 2008, 2009, 2010, 2011 and 2012. In other words, 15 out of the 19 years from 1994 to 2012, inclusive, had quick declines of 10% or more. Only two of these years (2001 and 2008) had declines that could reasonably be called crashes.

The periods from mid-2003 through to early-2007 and late-2012 through to mid-2015 were unusual because they did NOT contain any quick 10%+ declines. In other words, the 12.5% decline in the S&P500 Index (SPX) from its July peak to last Monday’s low was not extraordinary in an historical context, it only seemed extraordinary because the market had gone an unusually long time without experiencing such a decline. That is, it only seemed extraordinary due to “recency bias” (the tendency to think that trends and patterns we observe in the recent past will continue in the future). Furthermore and as noted in the email sent to subscribers late last week, this year’s July-August decline was significantly smaller than the July-August decline that formed part of a bull-market correction in 2011.

In summary, what happened over the past few weeks was not a crash by any reasonable definition of the word and was only extraordinary in the context of the unusually long period of low volatility that preceded it.

That being said, the recent market action could well have longer-term significance. Just as the sudden increase in volatility in 2007 following a multi-year period of exceptionally-low volatility marked the end of a cyclical bull market, the sudden increase in volatility over the past few weeks could be marking the end of a cyclical bull market. In fact, there is a better-than-even-money chance that this is the case.

Also, while the recent quick decline doesn’t meet a reasonable definition of a stock-market crash, it could be part of a developing crash pattern. Recall from previous TSI commentaries that a US stock-market crash pattern involves an initial sharp decline in the 7%-15% range (step 1) followed by a rebound that retraces at least 50% of the initial decline (step 2) and then a drop back to support defined by the low of the initial decline (step 3). A breach of support can then result in a crash. Step 1 of a potential crash pattern is complete and step 2 is now very close to being complete. Note, however, that even if steps 2 and 3 are completed over the next couple of weeks the probability of a crash will still be low, albeit much higher than it was a few weeks ago.

Print This Post Print This Post

Wrongheaded thinking about China’s devaluation

August 31, 2015

After China’s government announced a small reduction in the Yuan’s foreign exchange (FX) value early last month, US Presidential aspirant Donald Trump immediately leapt onto the nearest available podium and exclaimed:

They [the Chinese] continuously cut their currency. They devalue their currency. And I have been saying this for years. They have been doing this for years. This isn’t just starting. This was the largest devaluation they have had in two decades. They make it impossible for our businesses, our companies to compete. They think we’re run by a bunch of idiots. And what’s going on with China is unbelievable, the largest devaluation in two decades. It’s honestly…a disgrace.

The fact is that even after its recent “devaluation”, relative to the US$ the Yuan is up by 8% over the past 5 years and 30% over the past 10 years. Here’s a chart showing the performance (a rising line on this chart indicates a strengthening of the Yuan relative to the US$). Take a look at this chart and then re-read the above Trump comments.

Yuan_310815

Is Trump really that poorly informed about what’s going on? Perhaps, but probably not. It’s clear that Trump has become the consummate populist — someone who is willing to say anything that he thinks will strike a chord with a large mass of voters, even if he knows that what he is saying is complete nonsense.

In the case of China’s so-called devaluation, however, it isn’t just bombastic billionaires with a lust for political power who have misrepresented the situation. Anyone who has claimed that the Yuan’s devaluation was primarily about boosting exports has a poor understanding.

The reality is that the Yuan is very over-valued and has begun to fall under the weight of this over-valuation. Furthermore, rather than deliberately devaluing the Yuan, as part of its effort to maintain the semblance of stability China’s government has actually been trying to prevent the Yuan from devaluing. This can be deduced from the fact that China’s government has been selling-down its FX reserves (selling reserve-currency (mostly US$) assets and buying the Yuan puts upward pressure on the Yuan’s relative value). However, trying to prop-up the exchange rate via the selling of FX reserves and the simultaneous buying of the local currency is a form of monetary tightening, which, according to the fatally-flawed Keynesian theories that guide policymakers the world over, is the last thing that China’s economy needs right now.

Faced with the choice of keeping the Yuan’s FX value at an unrealistically high level via a form of monetary tightening or allowing the currency to start falling under the weight of its own over-valuation, China’s policymakers opted for the latter. Actually, they didn’t have much of a choice.

Print This Post Print This Post