December 28, 2014
The following charts are related to a market update that was emailed to TSI subscribers.
 Print This Post
 Print This Post
The following charts are related to a market update that was emailed to TSI subscribers.
Print This Post
Central banks will continue to create money in response to economic weakness until blatant “price inflation” stops them. This is why the US economic situation is all but guaranteed to deteriorate.
To explain, I point out that if the Fed had done nothing in response to the bust of 2000-2002 then there would have been a severe recession, but the economy would probably have made a full recovery by 2004 and there would have been no mortgage-credit/housing-investment bubble and therefore no 2007-2008 crisis. However, the Fed, in its wisdom and at the behest of intelligent idiots such as Paul Krugman and Paul McCulley, kept interest rates at artificially low levels for years and aggressively ramped up the money supply with the aim of speeding the recovery process. In doing so it fueled a further rapid expansion of debt and a new bubble.
If the Fed had done nothing when this new bubble inevitably burst in 2007-2008 then there would have been a more severe recession, but the US economy would probably have made a full recovery by 2010 or 2011. It would certainly not now be teetering on the verge of another devastating bust.
During 2001-2004 and again since 2008, the Fed felt free to encourage rapid increases in the supplies of money and credit because there were no obvious negative “price inflation” consequences to be seen by those who fixate on price indices such as the CPI. Therefore, the lack of an obvious “price inflation” problem in the US should be viewed as a threat, not a benefit. From the perspective of the people pulling the monetary levers, it provides carte blanche for more money-conjuring in response to economic weakness.
You see, from the collective perspective of the ‘master manipulators’ at the monetary politburo, creating money out of nothing is never a problem until it causes the general price level — which, by the way, can’t be measured, but that doesn’t stop them from pretending to measure it and coming up with figures upon which policies are based — to rise faster than some arbitrary number. They appear to have no inkling that the falsifying of interest rates and relative price signals distorts investment decisions and the structure of production in a way that leads to an economic bust that wipes out all the superficial gains made in response to the so-called monetary stimulus.
If money-pumping continues to be the knee-jerk reaction to every new bout of economic weakness, then a “price inflation” problem will eventually arise. The longer it takes to arise, the greater the amount of damage that will be done in the meantime.
Men of good will should therefore be hoping for an outbreak of “price inflation”, it seemingly being the only way to end the destructive policy-making.
Print This Post
A couple of weeks ago I posted some information about the “Great Depression of 1873-1896″ to make the point that there was no depression, great or otherwise, during this period, but that the period did contain some financial crises/panics. Paul Krugman and others have blamed these financial crises on the Gold Standard, but, as explained in a well-researched article by Brian Domitrovic, the financial crises of the 1800s had similar causes to the financial crises of the 1900s and 2000s: monetary inflation and government meddling. Here are the last few paragraphs in the aforelinked article, dealing with the financial crisis and economic recession of the early-to-mid 1890s:
“It is perfectly clear what caused both the huge run-up in output numbers from 1890-92, as well as the tremendous stress on the banking and credit system that led to the drying up of investment and the shuttering of factories in 1893 and beyond. The United States, in 1890, decided to traduce the gold standard.
1890 was the year in which Congress made two of its most intrusive forays into monetary and fiscal policy in the years before the creation of the Fed and the income tax in 1913. It authorized the creation of fiat money to the tune of nearly five million dollars a month, and it passed a 50% increase in tax rates in the principal form of federal taxation, the tariff.
The monetary measure came care of the Sherman Silver Purchase Act, whereby the United States was mandated to buy, with new paper currency, an additional 4.5 million ounces in silver per month. The catch: the currency that bought the silver had to be redeemable to the Treasury in gold too.
Silver-mining interests in Nevada and elsewhere had conned (and surely bribed) Congress into this endeavor. Knowing that their extensive silver was worth little, what better way to cash in on it than get a piece of paper that says the silver can be exchanged for gold, government-guaranteed?
The cascade of new money caused an asset bubble, the tariff made sure the bubble was especially deformed, and the most extended recession of the pre-1913 period hit. The United States, needless to say, ran out of gold to back all the extra currency. J.P. Morgan had to float a gold loan to bail out his pathetic government. With the private banking system devoting its resources to propping up the United States, the market got starved of cash, and the terrible recession came.
In our own era, the Fed prints excess dollars without concern that they be redeemable in gold. Which means that our capital misallocation is extensive and long-term, our recessions are long and deep, our growth trend is shallow, and our complacency about how right we are in contrast to the benighted past is callow and pitiable.”
Print This Post
After gold and the gold-mining indices crashed during the final few days of October and the first few days of November, the most likely pattern over the weeks ahead was a rebound and then a successful test of the crash low. Gold bullion successfully tested its crash low on 1st December, but the gold-mining indices didn’t fall far enough at that time to complete a test. The reason is that by the time the North American stock markets opened for trading on 1st December, the gold price had already bounced off its early-November low and was rocketing upward.
The 1st December price action indicated that the gold-mining sector might be able to avoid a test of its crash low, but it wasn’t to be. The HUI and the XAU have just closed lower for five days in a row and are now testing their early-November lows.
I expect the next up-day for the HUI, whether it be today (Wednesday the 17th) or tomorrow or the day after tomorrow, to mark the completion of a successful test of the early-November low and the start of a larger/longer rally than the initial post-crash rebound.
Print This Post
Based on Cyclically Adjusted PE (CAPE), Russia’s stock market is the second cheapest stock market in the world. Its current CAPE is around 5, compared to 27.9 for the US. By this measure only the Greek stock market is cheaper, but the Greek stock market has no dividend yield to speak of. Taking into account both CAPE and dividend yield, the Russian market is clearly the world’s cheapest (refer to http://www.starcapital.de/research/stockmarketvaluation for valuation data on many stock markets around the world). This means that it will probably generate outsized returns over the next few years. However, the following chart suggests that it won’t start providing relatively good returns until commodity prices begin trending upwards, regardless of how cheap it gets.
The chart shows that the RSX/EEM ratio (Russian equities relative to Emerging Market equities) trends with the Continuous Commodity Index (CCI). Russia is in the news a lot these days, due to geopolitical issues, economic sanctions and other economic problems, and, at the time of writing this post, a desperate effort to stop the devaluation of the Ruble by hiking the official interest rate from 10.5% to 17%, but it’s the trend in commodity prices that really matters.
Print This Post
This post is a modified excerpt from a commentary posted at TSI a few weeks ago.
At its recent low the HUI was trading at the same price at which it traded way back in 2003-2004, when the gold price was $350-$400/oz. On the surface, this suggests that at their recent lows the senior gold-mining stocks that dominate the HUI were absurdly under-valued relative to gold, given that gold was trading at around $1150/oz at the time. Just how extreme was the under-valuation?
According to the article posted HERE, the HUI’s under-valuation was so extreme it was completely irrational. For example, the article contains the following statements:
“While gold stocks indeed should’ve been sold with gold weaker, the magnitude of selling they suffered was far beyond anything justifiable fundamentally. This ultimately culminated in the latest gold-stock capitulation where the HUI plunged to 11.3-year lows! Think about that a second. Gold stocks were just trading at prices not seen since July 2003. Pretty much the entire secular gold-stock bull had been fully erased.”
And: “… [the] entire not-widely-followed gold-stock bull was based on the massive fundamental boost to gold-mining profits that gold’s own secular bull created. So if the recent gold-stock price levels were righteous, gold too should have been pounded back down towards its mid-2003 levels. Where was gold trading back then? Merely right around $350!”
And: “Do gold stocks deserve to trade today as if gold was at just $350? Heck no! Last week when gold stocks’ latest capitulation low was carved, the gold price was up near $1150. That was 3.3x higher than the last time the gold stocks traded at recent levels! It makes no fundamental sense whatsoever for gold stocks to trade as if gold was at $350 when it was actually $1150. Their core fundamentals are now vastly better.”
The analysis encapsulated in the above excerpts is superficial and misleading, for two main reasons. First, production costs are vastly higher now than they were in 2003-2004. Second, although the stock prices of the senior gold miners are, on average, not much higher now than they were when gold was trading at $350-$400/oz, their market capitalisations are hundreds of percent higher thanks to massive inflation of share quantities. Consequently, a good argument can be made that the “core fundamentals” are now worse than they were when the gold price was $350-$400.
I’ll now consider the specific case of Goldcorp (GG) to back-up my point. During the quarter ended 30th September 2003, GG managed to achieve a net profit of $0.13/share, a net operating margin of 44% and a return on invested capital (ROIC) of 22%. These results were achieved at an average realised sale price of $364/oz. During the quarter ended 30th September 2014 GG’s average realised sale price was $1266/oz, but the company reported a net LOSS of $0.05/share and was too embarrassed to highlight the ROIC. Note that there were no large asset writedowns in the latest quarter. GG was simply not profitable at $1266/oz in Q3-2014 after being very profitable at $364/oz way back in Q3-2003. And by the way, from Q3-2003 to Q3-2014 GG’s share count rose from 183M to 814M, so although its share price is up by ‘only’ about 50%, its market cap is up by about 580% over the period in question.
I selected GG for my quick-and-dirty case study because it has been one of the best-managed of the senior gold producers and has had less company-specific problems than some of its brethren. Had I chosen either Barrick Gold (ABX) or Kinross Gold (KGC) my point could have been made even more clearly, because the amount of wealth destroyed by these companies via ill-conceived acquisitions and project developments is mindboggling.
It’s important that fundamentals-oriented speculators who buy gold-mining stocks have their eyes wide open and understand the reality of the current situation. There are some good reasons to anticipate large gains in gold-stock prices over the coming 2 years involving a rising gold price, declining production costs and improving sentiment, but at the current gold price and with their current cost structures most gold producers are NOT particularly cheap by traditional valuation standards.
Therefore, don’t be hoodwinked by superficial comparisons into believing that gold stocks are now priced for a hundreds-of-dollars-per-ounce lower gold price and, as a consequence, that massive gains lie ahead for gold stocks even if the gold price flat-lines or continues to trend downward.
Print This Post
The historical record indicates that the gold-mining sector performs very well during the first 18-24 months of a general equity bear market as long as the average gold-mining stock is not ‘overbought’ and over-valued at the beginning of the bear market. Unfortunately, the historical sample size is small. In fact, since the birth of the current monetary system there have been only two relevant cases.
The first case involves the general equity bear market that began in January of 1973 and continued until late-1974. This bear market resulted in peak-to-trough losses of around 50% for the senior US stock indices.
The following chart comparison of the Barrons Gold Mining Index (BGMI) and the S&P500 Index shows that the gold-mining sector commenced a strong upward trend near the start of the general equity bear market. During the bear market’s first 20 months, the BGMI gained about 300%.
The second case involves the general equity bear market that began in September of 2000 and continued until early-2003. This bear market also resulted in peak-to-trough losses of around 50% for the senior US stock indices.
The following chart comparison of the HUI and the NYSE Composite Index (NYA) shows that the gold-mining sector commenced a strong upward trend about 2.5 months after the start of the general equity bear market. Despite the fact that the HUI suffered a substantial percentage decline during this 2.5-month period, it still managed to gain about 200% over the course of the bear market’s first 20 months.
The gold-mining sector is currently a long way from being ‘overbought’ and over-valued. In fact, by some measures it was recently as ‘oversold’ as it ever gets. The historical cases cited above would therefore be relevant if a general equity bear market were to begin in the near future.
On a related matter, the only times when the owners of gold-mining stocks need to fear a general equity bear market are those times when the gold-mining sector has trended upward with the broad stock market during the 6-12 months prior to the start of the general equity bear market. Consequently, in the unlikely event that the current bull market in US equities continues for one more year and gold-mining stocks trend upward during that year, the gold-mining sector will then be vulnerable to the downward pull of a general equity decline.
Print This Post
There is an excellent interview about China in the latest edition of Barrons magazine. The interviewee is Anne Stevenson-Yang, who, having spent the bulk of her professional life in China since first arriving in 1985, is extremely well-informed on the topic. She is fluent in Mandarin and is currently the research director of J Capital, a company that works for foreign investors in China doing fundamental research on local companies and tracking macroeconomic developments. Anyone interested in finding out what’s really going on in China should click the above link and read the full interview, but here are some excerpts:
“People are crazy if they believe any government statistics [such as the 7%+ GDP growth figures], which, of course, are largely fabricated. In China, the Heisenberg uncertainty principle of physics holds sway, whereby the mere observation of economic numbers changes their behavior. For a time we started to look at numbers like electric-power production and freight traffic to get a line on actual economic growth because no one believed the gross- domestic-product figures. It didn’t take long for Beijing to figure this out and start doctoring those numbers, too.
I put much stock in estimates by various economists, including some at the Conference Board, that actual Chinese GDP is probably a third lower than is officially reported. And as for the recent International Monetary Fund report calling China the world’s biggest economy on a purchasing-power-parity basis, how silly was that? China is a cheap place to live if one is willing to eat rice, cabbage, and pork, but it’s expensive as all get out once you factor in the cost of decent housing, a car, and health care.
I’d be shocked if China is currently growing at a rate above, say, 4%, and any growth at all is coming from financial services, which ultimately depend on sustained growth in the rest of the economy. Think about it: Property sales are in decline, steel production is falling, commercial long-and short-haul vehicle sales are continuing to implode, and much of the growth in GDP is coming from huge rises in inventories across the economy. We track the 400 Chinese consumer companies listed on the Shanghai and Shenzhen stock markets, and in the third quarter, their gross revenues fell 4% from a year ago. This is hardly a vibrant economy.”
And:
“The giant government economic-stimulus programs since 2008 are rapidly losing their effectiveness. The reason is simple. Much of the money has been squandered in money-losing industrial projects and vanity infrastructure spending that make no economic sense beyond supplying temporary bump-ups in GDP growth. China is riding an involuntary credit treadmill where much new money has to be hosed into the economy just to sustain ever-mounting bad-debt totals. Capital efficiency, or the amount of capital it takes to generate a unit of GDP growth, has soared as a result.”
And:
“The Chinese home real estate market, mostly units in high-rise buildings, is truly bizarre. Many Chinese regard apartments as capital-gains machines rather than sources of shelter. In fact, there are 50 million units in China that are owned but vacant. The owners won’t rent them because used apartments suffer an immediate haircut in value.
It’s as if the government created a new asset class that no one lives in. This fact gives lie to the commonly held myth that the buildout of all these empty towers and ghost cities is a Chinese urbanization play. The only city folk who don’t own housing are the millions of migrant laborers continuously flocking to Chinese cities. Yet, they can’t afford the new housing.”
And:
“All of China’s major corporations are speculating on residential real estate with either cash reserves or borrowed money. Who wants to build, say, a shipbuilding plant when a company thinks it can make a lot more speculating in the housing market?”
And:
“…liquidity seems to be a growing problem in China. Chinese corporations have taken on $1.5 trillion in foreign debt in the past year or so, where previously they had none. A lot of it is short term. If defaults start to cascade through the economy, it will be more difficult for China to hide its debt problems now that foreign investors are involved. It’s here that a credit crisis could start.”
And:
“As for Xi’s much-ballyhooed anticorruption campaign inside China, it offends me that international media depict it as a good-governance effort. What’s really going on is an old-style party purge reminiscent of the 1950s and 1960s with quota-driven arrests, summary trials, mysterious disappearances, and suicides, which has already entrapped, by our calculations, 100,000 party operatives and others. The intent is not moral purification by the Xi administration but instead the elimination of political enemies and other claimants to the economy’s spoils.”
China is an economic disaster happening in slow motion, but it is not a good idea to be short the country’s stock market.
Print This Post
Since coming into existence in 1913, the Federal Reserve has helped facilitate a massive decline in the purchasing power of the US dollar. However, the Fed is not the root of the US monetary problem, as evidenced by the fact that there were several US financial crises/panics during the half-century prior to the establishment of the Fed. As explained by Murray Rothbard (America’s greatest economics historian), these pre-Fed financial panics “were a result of the arbitrary credit creation powers of the banking system.” In other words, the root of the problem is — and has always been — the legal ability of banks to create credit ‘out of thin air’, commonly referred to as fractional reserve banking. With or without a central bank, fractional reserve banking will tend to bring about a boom/bust cycle and thus reduce the long-term rate of economic progress.
Central banking is perhaps history’s best example of government attempting to fix a problem — in this case, the instability resulting from the practice of fractional reserve banking — and making things much worse in the process. The fact that fractional reserve banking leads to periodic crises suggests the following solution: banks should not be allowed to create new money out of nothing, that is, banks should be subject to the same laws as everyone else. However, the big banks tend to be politically influential, and imposing proper restrictions on the banking industry’s ability to expand its collective balance sheet would also restrict the government’s ability to grow, so rather than address the underlying problem the government put in place a system that would enable arbitrary credit creation to continue for much longer and to a much greater extreme without a ‘cleansing’ crisis. In the US, this “system” is called the Federal Reserve. Since the advent of the Federal Reserve there have been longer periods of apparent stability followed by much greater financial crises and economic downturns (the three most severe peace-time economic downturns in the US (the downturns of the 1930s, the 1970s and the 2000s) occurred since the birth of the Fed). There has also been a dramatic increase in the size of the US federal government, with its adverse consequences for freedom.
So, fractional reserve banking caused financial panics and boom-bust economic cycles in the US prior to the creation of the Fed, but crises and recessions in the pre-Fed era were relatively short and the economy tended to recover far more quickly. How, then, do I explain the “great depression” of 1873-1896, which some commentators cite in an effort to ‘prove’ that the Gold Standard doesn’t work and that central banking can be beneficial?
The short answer is that there was no “great depression” during 1873-1896. Thanks to excessive deposit creation (fractional reserve banking) there were three financial panics during this period (in 1873, 1884 and 1893), but the overall economy achieved very strong real growth.
For a longer answer I turn to the following excerpts from Murray Rothbard’s “A History of Money and Banking in the United States”:
“Orthodox economic historians have long complained about the “great depression” that is supposed to have struck the United States in the panic of 1873 and lasted for an unprecedented six years, until 1879. Much of this stagnation is supposed to have been caused by a monetary contraction leading to the resumption of specie payments in 1879. Yet what sort of “depression” is it which saw an extraordinarily large expansion of industry, of railroads, of physical output, of net national product, of real per capita income? As Friedman and Schwartz admit, the decade from 1869 to 1879 saw a 3-percent-perannum increase in money national product, an outstanding real national product growth of 6.8 percent per year in this period, and a phenomenal rise of 4.5 percent per year in real product per capita. Even the alleged “monetary contraction” never took place, the money supply increasing by 2.7 percent per year in this period. From 1873 through 1878, before another spurt of monetary expansion, the total supply of bank money rose from $1.964 billion to $2.221 billion — a rise of 13.1 percent or 2.6 percent per year. In short, a modest but definite rise, and scarcely a contraction.
It should be clear, then, that the “great depression” of the 1870s is merely a myth — a myth brought about by misinterpretation of the fact that prices in general fell sharply during the entire period. Indeed, they fell from the end of the Civil War until 1879.
Friedman and Schwartz estimated that prices in general fell from 1869 to 1879 by 3.8 percent per annum. Unfortunately, most historians and economists are conditioned to believe that steadily and sharply falling prices must result in depression: hence their amazement at the obvious prosperity and economic growth during this era. For they have overlooked the fact that in the natural course of events, when government and the banking system do not increase the money supply very rapidly, freemarket capitalism will result in an increase of production and economic growth so great as to swamp the increase of money supply. Prices will fall, and the consequences will be not depression or stagnation, but prosperity (since costs are falling, too), economic growth, and the spread of the increased living standard to all the consumers.”
…”It might well be that the major effect of the panic of 1873 was not to initiate a great depression, but to cause bankruptcies in overinflated banks and in railroads riding on the tide of vast government subsidy and bank speculation.”
…”The record of 1879-1896 was very similar to the first stage of the alleged great depression from 1873 to 1879. Once again, we had a phenomenal expansion of American industry, production, and real output per head. Real reproducible, tangible wealth per capita rose at the decadal peak in American history in the 1880s, at 3.8 percent per annum. Real net national product rose at the rate of 3.7 percent per year from 1879 to 1897, while per-capita net national product increased by 1.5 percent per year.
Once again, orthodox economic historians are bewildered, for there should have been a great depression since prices fell at a rate of over 1 percent per year in this period. Just as in the previous period, the money supply grew, but not fast enough to overcome the great increases in productivity and the supply of products. The major difference in the two periods is that money supply rose more rapidly from 1879 to 1897, by 6 percent per year, compared with the 2.7 percent per year in the earlier era. As a result, prices fell by less, by over 1 percent per annum as contrasted to 3.8 percent. Total bank money, notes, and deposits rose from $2.45 billion to $6.06 billion in this period, a rise of 10.45 percent per annum — surely enough to satisfy all but the most ardent inflationists.”
“The financial panics throughout the late nineteenth century were a result of the arbitrary credit creation powers of the banking system. While not as harmful as today’s inflation mechanism, it was still a storm in an otherwise fairly healthy economic climate.”
In summary, a 23-year period in which the US economy achieved the strongest real growth in its history is strangely characterised in some quarters as a “great depression”, quite likely because so many economists and historians do not understand that real economic progress puts DOWNWARD pressure on prices. Unfortunately, there is no chance that the next 10 years will be anything like the so-called “great depression” of late 19th Century. We won’t be so lucky.
Print This Post
This blog post is a slightly modified excerpt from a recent TSI commentary.
Back in July of last year I pointed out that in a world where official short-term interest rates are close to zero, some short-term market interest rates are also going to be very close to zero, and that, in such cases, interest-rate dips below zero could occur as a result of insignificant price fluctuations. A topical example at the time was “gold backwardation”, meaning the price of gold for immediate delivery moving above the price of gold for future delivery. Gold backwardation is still a topical example and, thanks to the persistence of near-zero official US$ interest rates, is still not significant. What I mean is that the “backwardation” has almost everything to do with the near-zero official short-term interest rate and almost nothing to do with gold supply/demand. So please, gold analysts, stop pretending otherwise!
When the gold market is in backwardation, something called the Gold Forward Offered Rate (GOFO) will be negative. A negative GOFO effectively just means that it costs more for a major bank to borrow gold than to borrow US dollars for a short period. In a situation where the relevant short-term US$ interest rate (LIBOR) is close to zero, why would this be important or in any way strange?
The answer is that it wouldn’t be. What’s strange is an official US$ interest rate pegged near zero. Given this US$ interest rate situation, it is not at all surprising or meaningful that the GOFO periodically dips into negative territory and the gold market slips into “backwardation”.
The charts displayed below illustrate the point I’m attempting to make. The first chart shows the 1-month GOFO and the second chart shows the 1-month LIBOR. Notice that apart from a couple of spikes in one that don’t appear in the other, these charts are essentially identical. The message is that GOFO generally tracks LIBOR, so with the Fed having effectively pegged LIBOR near zero since late-2008 it would be normal for GOFO to fluctuate around zero and to sometimes be negative.
The upshot is that a negative GOFO (and, therefore, a “backwardated” gold market) would be a meaningful signal if LIBOR were at a more normal level (say, 3%), but with LIBOR near zero it should be expected that GOFO will periodically move below zero. In other words, there won’t be a useful signal from GOFO until official US$ interest rates move up to more normal — or at least up to less abnormal — levels.
Before ending this post, here are two related points on gold-linked interest rates:
First, the Gold Lease Rate (GLR) that you see quoted in various places is equal to LIBOR minus GOFO. It is a derived quantity and not the actual amount that is paid to borrow gold. The actual amount that any gold borrower pays in interest will be negotiated on a case-by-case basis with the gold lender and will NEVER be negative. In other words, although the derived GLR will sometimes go into negative territory, this doesn’t mean that people are being paid to borrow gold.
Second, a lower GOFO implies a higher (not lower) cost to borrow gold. GOFO’s recent dip into negative territory therefore implies that the cost to borrow gold has risen, although the percentage changes have been tiny and, as noted above, the lease rate paid by a specific borrower will generally not be the same as the GLR published by the LBMA and charted at web sites such as Kitco.com.
Print This Post
Here are the charts referenced in a Market Alert email just sent to TSI subscribers.
Print This Post
It is not uncommon for people who make predictions about the financial markets to be right for the wrong reasons, meaning that even though their reasoning turned out to be wrong the market ended up doing roughly what was predicted. Here are two examples that explain what I’m talking about.
The first example involves the popular forecast, during 1995-2000, that the US stock market would continue to be propelled upward by a technology-driven productivity miracle. This reasoning was used by high-profile analysts such as Abby Joseph Cohen to explain why stratospheric valuations would go even higher. As long as the bull market remained intact these analysts were generally held in high regard, but their reasoning was terribly flawed.
Anyone with a basic understanding of good economic theory knows that increasing productivity causes prices to fall, not rise. Furthermore, while it is certainly possible for some individual companies to justifiably obtain higher market valuations by becoming more productive than their competitors, a general increase in productivity will not cause a sustained, economy-wide increase in corporate profitability and will not justify higher valuations for most equities. To put it another way, the main beneficiaries of higher productivity are consumers, not stock speculators and investors in equity-index funds. Consequently, there was never a possibility that rising productivity was behind the 1995-2000 surge in the US stock market. “Rising productivity” was just a story that sounded good to the masses while the market was going up.
Like all bull markets in major asset classes, the bull market in US equities that ended in 2000 was driven by the expansions of money and credit. After the pace of monetary expansion slowed, the bull market naturally collapsed.
The second example involves the forecast, in 2011-2012, that the gold price was destined to fall a long way due to deflation. Regardless of whether your preferred definitions of inflation and deflation revolve around money supply, credit supply, asset prices or consumer prices, there has been no deflation and plenty of inflation over the past 2-3 years, so advocates of the “gold is going to lose a lot of value due to deflation” forecast could not have been more wrong in their reasoning. However, the gold market has performed as predicted!
Rather than being a victim of deflation, gold was a victim of the reality that over the past three years a bout of rampant monetary inflation led to a huge rally in the broad stock market, which, in turn, boosted economic confidence. Ironically, had the reasoning of the “gold to fall due to deflation” group been close to the mark, the gold price would probably have experienced nothing more than a 12-18 month consolidation following its September-2011 peak. This is not because gold benefits from deflation (it doesn’t), but because the combination of economic weakness, declining economic confidence and the actions taken by central banks to address the economic weakness would have elevated the investment demand for gold.
I’ve noticed that fundamentals-based analysis is rarely questioned if it matches the price action and, by the same token, is often greeted with skepticism if it is in conflict with a well-established price trend. During a raging bull market even the silliest bullish analyses tend to be viewed as credible, and after a bear market has become ‘long in the tooth’ even a completely illogical or irrelevant piece of analysis will tend to be viewed as smart, or at least worthy of serious consideration, if its conclusion is bearish. However, from a practical investing perspective, fundamental analysis can be most useful when its conclusions are at odds with the current price trend. The reason is that the greatest opportunities for profit in the world of investing and long-term speculation are created by divergences between value and price.
Print This Post
This blog post is a slightly-modified excerpt from a recent TSI commentary.
At the beginning of this year, banking behemoth Goldman Sachs (GS) called for gold to end the year at around $1050/oz. I didn’t agree with this forecast at the time and still believe it to be an unlikely outcome (although less unlikely than it was a few months ago), but earlier this year I gave Goldman Sachs credit for at least looking in the right direction for clues as to what would happen to the gold price. In this respect the GS analysis was/is vastly superior to the analysis coming from many gold-bullish commentators.
Here’s what I wrote at TSI when dealing with this topic back in April:
“GS’s analysis is superior to that of many gold bulls because it is focused on a genuine fundamental driver. While many gold-bullish analysts kid themselves that they can measure changes in demand and predict prices by adding up trading volumes and comparing one volume (e.g. the amount of gold being imported by China) to another volume (e.g. the amount of gold being sold by the mining industry), the GS analysts are considering the likely future performance of the US economy.
The GS bearish argument goes like this: Real US economic growth will accelerate over the next few quarters, while interest rates rise and inflation expectations remain low. If this happens, gold’s bear market will continue.
The logic in the above paragraph is flawless. If real US economic growth actually does accelerate over the next few quarters then a bearish view on the US$ gold price will turn out to be correct, almost regardless of what happens elsewhere in the world. The reason the GS outlook is probably going to be wrong is that the premise is wrong. Specifically, the US economy is more likely to be moribund than strong over the next few quarters. It’s a good bet that inflation expectations will remain low throughout this year, but real yields offered by US Treasuries are more likely to decline than rise due to signs of economic weakness and an increase in the popularity of ‘safe havens’ as the stock market trends downward.”
I was right and GS was wrong about interest rates, in that both nominal and real US interest rates are lower today than they were in April. However, it is certainly fair to say that GS’s overall outlook as it pertains to the gold market has been closer to the mark than mine over the intervening period. This is primarily because economic confidence has risen, which is largely due to the continuing rise in the senior US stock indices.
So, regardless of whether or not gold ends up getting closer to GS’s $1050/oz target before year-end (I don’t think it will), I give GS credit for being mostly right for mostly the right reasons over the course of this year to date.
For their part, many gold bulls continue to look in the wrong direction for clues as to what the future holds in store. In particular, they continue to fixate on trading volumes, seemingly oblivious to the fact that for every net-buyer there is a net-seller and that the change in price is the only reliable indicator of whether the buyers or the sellers are the more motivated.
Print This Post
The gold-stock indices and ETFs are getting close to reasonable upside targets for the INITIAL rallies from their October-November crash lows. These targets are defined by resistance at 185-190 for the HUI and 77-80 for the XAU. For GDXJ, the upside target for the initial rally mentioned at TSI was $29, which has already been reached. Actually, the resistance that defines the most realistic initial rally target for GDXJ extends from $29 to $31.50.
The main purpose of this brief post is to point out that something has just happened that hasn’t happened since the first half of June. I’m referring to the fact that for the first time in more than 5 months, GDXJ has just achieved 3 consecutive up-days.
This is just another small piece of a big puzzle. It is evidence that the current rebound could evolve into something substantial.
Print This Post
The concept that must always be kept in mind when analysing changes in the amount of gold bullion held by the SPDR Gold Trust (GLD), the largest gold bullion ETF, is that these changes can only happen as a result of arbitrage. More specifically, the Authorised Participants (APs) in the ETF will only add gold to the inventory when an arbitrage opportunity is created by the price of a GLD share moving above the net asset value (NAV) of a GLD share and remove gold from the inventory when an arbitrage opportunity is created by the price of a GLD share moving below the NAV of a GLD share.
The addition of the gold involves multiple steps (the short-selling of GLD shares, the purchase of gold bullion, the delivering of gold bullion to the ETF and the creation of new GLD shares that are used to cover the aforementioned short position) that occur almost simultaneously, but the key is that it is a mechanistic process that a) gets initiated by GLD’s market price moving above its NAV and b) serves the purpose of closing the price-NAV gap. Similarly, there are multiple virtually-simultaneous steps involved in the removal of gold from GLD’s inventory (the buying of GLD shares, the short-selling of gold bullion, the redeeming of GLD shares for gold bullion from GLD’s inventory, and the use of the bullion obtained from the inventory to cover the aforementioned gold short position). And again, it is a mechanistic process that a) gets initiated by GLD’s market price moving below its NAV and b) serves the purpose of closing the price-NAV gap.
In the hope of adding clarity I’ll mention two related points.
First, it is not possible for GLD’s gold inventory to be used to cover short positions elsewhere in the gold market except as part of the arbitrage described above.
Second, because GLD holds gold bullion, a change in the price of gold will not necessitate a change in GLD’s inventory. GLD’s shares will naturally track the price of gold without the need to do anything, regardless of how far or how fast the price of gold moves.
That being said, there are times when the buyers of GLD shares become over-eager, causing the market price of GLD to rise relative to the price of gold, and there are times when the sellers of GLD shares become over-eager, causing the market price of GLD to fall relative to the price of gold. This sets in motion the arbitrage described above.
Now, buyers are most likely to become over-eager after the price has been trending higher for a while and sellers are most likely to become over-eager after the price has been trending lower for a while. That’s why the chart presented below shows that major trends in the GLD inventory FOLLOW major trends in the gold price, and why it makes more sense to view 2013′s large decline in GLD’s gold inventory as an effect, not a cause, of the large decline in the gold price.
Print This Post
I start reading a lot more articles about gold than I finish reading. This is because as soon as I read something in an article that reveals a very basic misunderstanding about the gold market, I stop reading. Sometimes I don’t even get past the first paragraph. Life is too short and there is so much to read that I refuse to waste time reading the words of someone who has just demonstrated cluelessness on the topic at hand. Here are some of the ‘red flag’ statements and arguments in a gold-related article that would stop me in my tracks.
1) Treating annual gold mine production as if it were a large part of the supply side of the equation.
In other metals markets it can make sense to treat new mine supply as if it were a proxy for total supply, but in the gold market the mining industry’s annual production is roughly equivalent to only 1.5% of total supply (see my earlier post on this topic). Therefore, as soon as an article starts comparing the amount of gold bought by a country or market segment with the mining industry’s annual production, as if the mining industry’s production was the main way in which gold demand could be satisfied, I stop reading.
2) Misunderstanding the relationship between supply, demand and price.
Many gold-market analyses are unwittingly based on the premise that the law of supply and demand doesn’t apply to gold. What I mean is that a lot of what passes for analysis in the gold market contains comments to the effect that the demand for physical gold rose relative to supply during a period even though the price fell during that period. I stop reading as soon as I see a comment along these lines. The author of the article may as well have held up a big sign that says: “You’re wasting your time reading this because I’m completely clueless”.
The falling price in parallel with rising demand scenario favoured by too many gold-market commentators is absolutely, unequivocally, impossible. If demand is attempting to rise relative to supply, then the price MUST rise. Note that I say “attempting” to rise, because, in a market that is able to clear (such as the gold market), supply and demand will always be the same, with the price changing to whatever it needs to be to maintain the balance. Furthermore, the change in price is the only way to tell whether demand is attempting to rise relative to supply or whether supply is attempting to rise relative to demand. If the price falls over a period then it is an irrefutable fact that demand attempted to fall relative to supply during that period.
On a related matter, many people fall into the trap of confusing trading volume with demand. However, trading volume generally doesn’t imply anything about demand or price.
A change in volume is never an explanation for a price change and is never an indication of whether demand is attempting to rise or fall relative to supply. The reason is that every transaction involves an increase in demand on the part of the buyer and an exactly offsetting decrease in demand on the part of the seller.
3) The selling of “paper gold” explains how the price of physical gold can fall in parallel with surging demand for physical gold.
No, it doesn’t; an increase in the demand for physical gold cannot be satisfied by an increase in the supply of “paper gold”. Regardless of what is happening in the so-called “paper” markets (e.g., the futures market), if the demand for physical gold attempts to rise relative to the supply of physical gold then the price of physical gold will rise to maintain the balance.
Now, you could reasonably argue that the goings-on in the “paper” markets affect the physical market in such a way that the holders of physical gold offer their gold for sale at lower prices than would otherwise have been the case, but this is very different from arguing that the price fell while demand increased relative to supply. For anyone who cares about logic and who understands the most basic law of economics, the latter argument is nonsense.
4) Adding up the flows of gold between different geographic regions or between different parts of the market as if the resultant information could explain past price movements and predict future price movements.
This is a corollary to item 2). It involves making the mistake of treating trading volume as a fundamental driver of price. In popular gold market analyses, this mistake most often manifests itself as treating the flow of gold into China as if it were a hugely bullish fundamental.
Think of the gold world as containing only two traders called China and World-Excluding-China (WEC). If WEC becomes a net seller of gold, then China must become a net buyer of gold to the same extent. The question is: How far will the price have to fall before China is prepared to buy all the gold that WEC wants to sell or WEC’s desire to sell is sufficiently reduced to restore balance? By the same token, if WEC becomes a net buyer of gold, then China must become a net seller of gold to the same extent. The question then becomes: How far will the price have to rise before China is prepared to sell all the gold that WEC wants to buy or WEC’s desire to buy is sufficiently reduced to restore balance?
The answers to such questions are never known ahead of time. In any case, the point is that flows of gold from one part of the world to another convey little or no information about price, so why do so many gold-market analysts fixate on them?
5) Presenting intra-day price charts showing sharp ‘inexplicable’ declines to make the case that the gold price is being manipulated downward.
This counts as misinformation by omission, as even during a downward trend there will be roughly as many sudden and ‘inexplicable’ intra-day price rises as there are price declines. This has been demonstrated by “Kid Dynamite” HERE and in the related articles at the bottom of the linked post. (Note: In case it isn’t obvious, Kid Dynamite is not attempting to show that the gold price is being manipulated upward. With tongue firmly planted in cheek, he is attempting to show that similar ‘evidence’ used to support the downward manipulation case can be used to support an upward manipulation case.)
You should ask yourself why some bloggers and newsletter writers only show you the intra-day downward spikes. Are they unaware of the upward spikes, or are they trying to mislead you?
Print This Post
I was just sent THIS LINK (thanks Richard) to a very interesting article. Actually, the entire web site (Capitalist Exploits) looks like it would be worth exploring, but at this stage I’ve only read the one article.
The article shows the average annual 3-year returns from a bombed-out sector, industry and country. For example, it points out that stock-market sectors that have fallen by 80% from their highs have, on average, achieved a nominal return of 172% per year over the ensuing 3 years.
With GDXJ having suffered a peak-to-trough shellacking of 87%, this has relevance to the gold-mining sector.
The gold sector’s 2-3 year risk/reward is phenomenally attractive, regardless of whether or not gold’s long-term bull market is intact. However, it would be unwise to attempt to take advantage of this exceptional intermediate-to-long-term profit potential via leveraged ETFs. I explained why in a previous post.
Print This Post
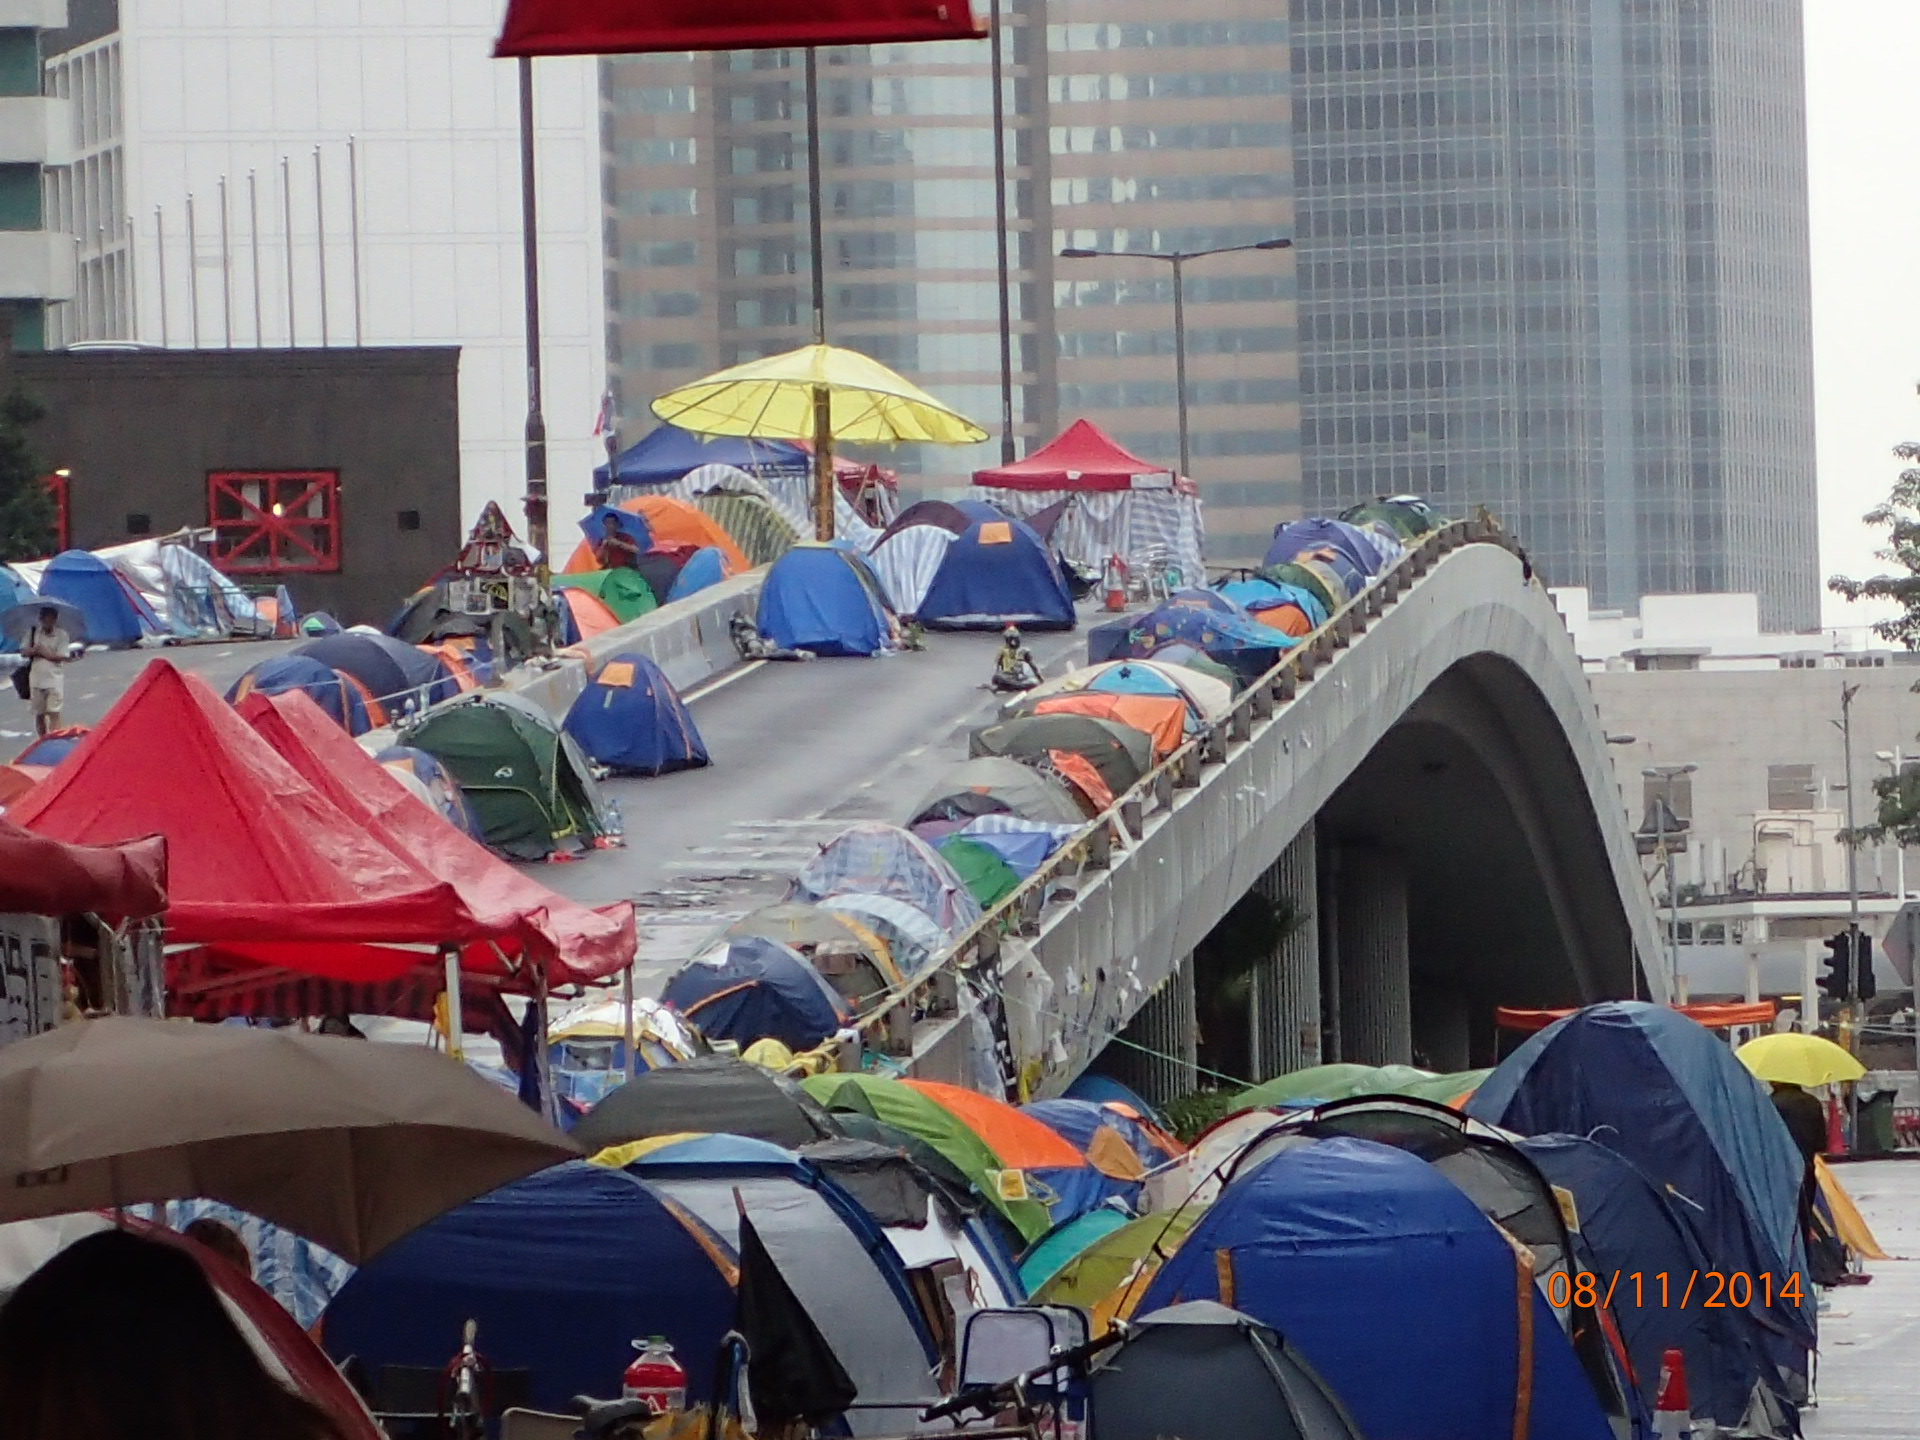
I went to Hong Kong last weekend to get a first-hand look at the protests that are now commonly referred to as the “Umbrella Movement”. I went there believing that the protest movement had very little chance of achieving its main objective, which is to gain a ‘free and fair’ election process for Hong Kong, and came away with the same opinion.
The current protests are taking place in three parts of HK — in the streets around the central government offices in Admiralty (near Central on Hong Kong Island), along part of Nathan Road in Mong Kok (a major shopping area on the Kowloon side of HK), and Causeway Bay (a popular shopping/tourist area on Hong Kong Island). Protestors have blocked off some main streets using makeshift barricades and set up camp.
This must be one of the most peaceful mass protests ever. There are thousands of tents on the streets in the protest areas, but apart from numerous signs demanding “civil nomination” for political office and a few people giving speeches to small crowds at night-time, it doesn’t even seem like a protest. Rather, it seems as if a tent-dwelling community decided to make a home in the middle of a bustling metropolis. There are first-aid tents, covered study areas with many desks so that the students participating in the protest can keep up with their schoolwork, food and drink distribution points, and basic toilet/shower facilities. Also, the occupied areas are kept clean and tidy (there is no rubbish lying around). There was a police presence at Mong Kok (a few dozen uniformed police men and women were standing around the outside of the protest area looking bored), but not at Admiralty.
Here are some of the photos I took.
These photos show the tent cities:


These photos show what is now known as “Lennon Wall”. The wall is part of an elevated road in Admiralty and is coated with countless thousands of messages of support.


Finally, these photos show a first-aid tent, two covered study areas, and examples of the protestors’ artwork:


Overall, it appears to be business as usual in HK. Most people are going about their daily lives as if nothing out of the ordinary is going on, and Hong Kong has adjusted to having no vehicular access to the parts of the city occupied by the protestors. However, the situation could turn ugly, as it did for a few days in September, if the government makes another attempt to forcibly remove the protestors.
Although I couldn’t gauge the general level of support for the protest movement within the HK population, I suspect that most HK residents do not want to ‘rock the boat’ for the sake of greater political freedom. Furthermore, there is clearly some animosity towards the protestors on the part of HK people whose businesses have been disrupted by having some main streets blocked off. In one case, this animosity took the form of a high-volume tirade from a taxi driver when he was asked by my wife for his opinion about the protests.
Hong Kong’s rapidly-rising cost of living is one of the root causes of the discontent that led to the mass protests, but this problem would almost certainly not be addressed by ‘the people’ gaining more influence over who occupies the top political offices. The reason is that hardly anyone involved in the protest movement understands that the high cost of living is due to HK being crushed between the inflationary policies of the US and China.
Thanks to the HK dollar’s peg to the US dollar, HK’s monetary authority essentially follows the US Federal Reserve. This means that despite the steep upward trend in HK prices, interest rates are still being held near zero and the money supply is still being inflated at a brisk pace (it is up by 15% over the past 12 months). At the same time, as a result of the appreciation of the Yuan relative to the US$ and the large price rises in China’s major cities courtesy of rampant monetary inflation in that country, prices in HK still appear reasonable to the mainland Chinese who continue to flood into HK to spend money.
Hong Kong’s “inflation” problem looks destined to get worse over the coming 12 months, which could lead to more widespread support for the “Umbrella Movement”. But in the absence of a general understanding of the nature of the problem, taking a step in the direction of democracy is not going to help.
Print This Post
The gold mining sector entered crash mode last Wednesday (29th October). These types of events typically last 5-6 trading days, although they are sometimes a little shorter and sometimes a little longer. Based on the typical length of a multi-day crash the most likely time for a low is therefore this Tuesday (day 5) or Wednesday (day 6).
It is not uncommon for a multi-day crash to be interrupted by one ‘up day’. For example, a 6-day crash could entail three down days followed by an up day and then two more down days to complete the decline. Monday’s bounce in the gold-mining indices and ETFs is therefore not evidence that the crash is over. However, another advance of at least a few percent on Tuesday 4th November would be evidence that the crash is over.
Incredibly, both the Central Fund of Canada (CEF) and the Central Gold Trust (GTU) are now trading at discounts to their net asset values of almost 10%. This means that purchasing CEF near its current price is roughly equivalent to paying $1050/oz for gold and $14.50/oz for silver. The unusually large discounts at which these bullion funds are now trading is an indication that gold and silver are almost as out-of-favour as they ever get.
Print This Post