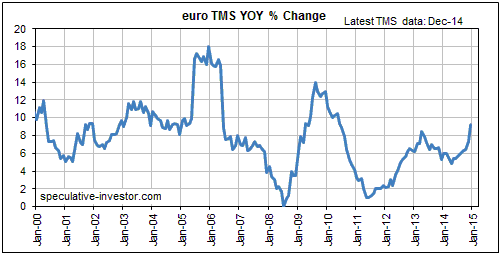
The following chart of euro-zone True Money Supply (TMS) was part of a discussion on monetary inflation in a TSI commentary published last Sunday.
The ECB introduced a new QE program about two weeks ago. This program is scheduled to get underway in March and will add to the euro-zone money supply, but my TMS chart indicates that the euro-zone’s monetary inflation rate has already accelerated. Specifically, the chart shows that the year-over-year (YOY) rate of growth in euro TMS began to trend upward during the second quarter of last year and ended the year above 9%, which is the highest it has been since the first half of 2010. Note that there was a money-supply surge late last year that pushed the YOY growth rate up from 6.4% in October-2014 to 7.3% in November-2014 to 9.3% in December-2014. In other words, the ECB has introduced a new money-pumping program at a time when the money-supply growth rate is already high and rising.
By the way, this is not short- or intermediate-term bearish for the euro. On the contrary, it will be a bullish influence on the euro/US$ exchange rate if it causes European equities to build on their recent relative strength.

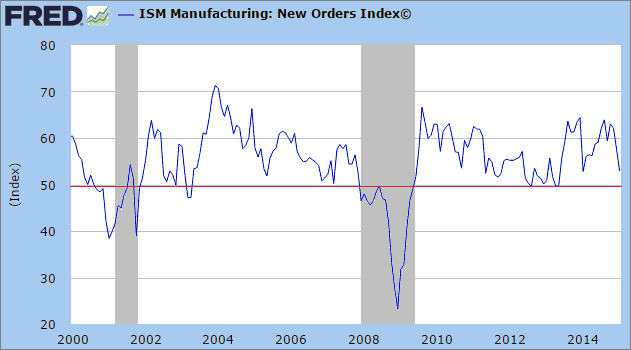
The next chart shows the ISM Manufacturing New Orders Index.
The New Orders Index is a US recession indicator. Its message at this time is that a recession is not imminent, although the downturn of the past two months opens up the possibility that a recession signal will be generated within the next couple of months. I currently don’t expect it, but it could happen.
As a recession indicator the historical record of the New Orders Index is good, but not perfect. Sometimes it signals a recession that never comes. However, there is a leading indicator of US recession with a perfect track record, and I’m not talking about the yield curve. This indicator’s current position will be discussed in the next TSI commentary.
 Print This Post

