Two weeks ago I discussed the claim that the US debt/GDP ratio (the debt of the US federal government divided by US GDP) drove the gold price, with a rising debt/GDP ratio resulting in a higher gold price and a falling debt/GDP ratio resulting in a lower gold price. I explained that the claim was misleading, and that a chart purporting to demonstrate this relationship was both an example of data mining (in this case, cherry-picking a timescale over which the relationship worked while ignoring more relevant timescales over which it didn’t work) and an example of confusing correlation with causation. I also mentioned in passing that there was a similar misleading claim doing the rounds regarding the relationship between gold and the US monetary base (MB). Considering that the failure of the gold price to follow the US MB higher over the past two years is being cited by the usual suspects as evidence of gold-market manipulation, I’ll now briefly address the question: Does the US monetary base drive the gold price?
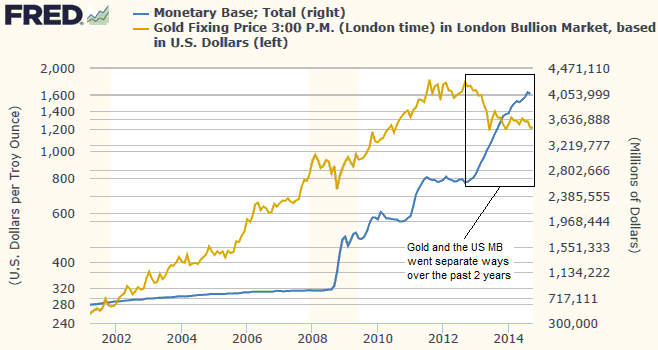
Those who believe that the answer to the question is “yes” will sometimes show a chart like the one presented below to prove the correctness of their belief. Clearly, if you were armed only with this chart and the conviction that a substantial rise in the US MB should always go hand-in-hand with a rallying gold price, then you would likely take the happenings of the past two years as definitive evidence of artificial gold-price suppression. Of course, you would also have to put aside the fact that the gold price rose 300% from its 2001 low to its early-2008 peak with only a minor increase in the US MB, but this wouldn’t be a problem because it is always easy to come up with a fundamental reason for a large rise in the gold price. It’s only a large price decline that needs to be explained-away by a manipulation theory.

So, is gold’s divergence over the past two years from the on-going rise in the US MB strange or suspicious, such that it can be best explained by market manipulation?
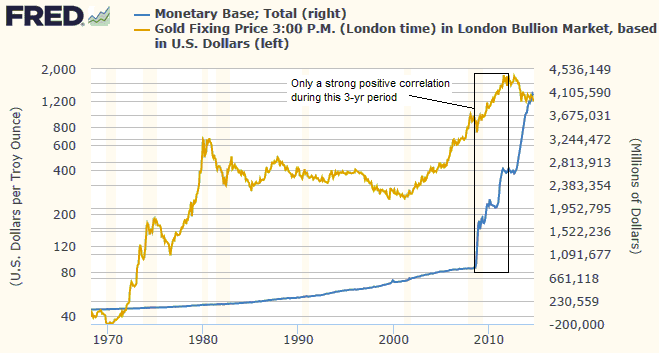
The answer is no. As is the case with the relationship between the gold price and the debt/GDP ratio, the visually-appealing positive correlation of the past several years disappears when the gold-MB relationship is viewed over a much longer timescale. Specifically, the following chart shows that the only period over the past 45 years during which there was a strong positive correlation between the gold price and the monetary base was the three-year period from late-2008 through to late-2011.

I wish that anticipating the performance of the US$ gold price were as easy as monitoring the US monetary base or the Fed’s balance sheet (the monetary base is controlled by the Fed via the expansion/contraction of its balance sheet), but unfortunately the gold market isn’t that simple. The reality is that like a rising debt/GDP ratio, a sharply rising monetary base can be a valid part of a bullish gold story. However, this is only to the extent that it helps to bring about lower real interest rates and/or a steeper yield curve and/or a weaker US dollar and/or rising credit spreads. It isn’t directly bullish.
I think that the first leg of the next substantial multi-year rally in the gold price will be linked to the Fed’s efforts to stabilise or contract the monetary base, because these efforts will expose the mal-investments of the past few years.
 Print This Post
