Print This Post Print This Post

The US dollar’s cyclical decline

April 22, 2025

[This blog post is a modified excerpt (for example, it contains updated charts) from a recent commentary published at www.speculative-investor.com]

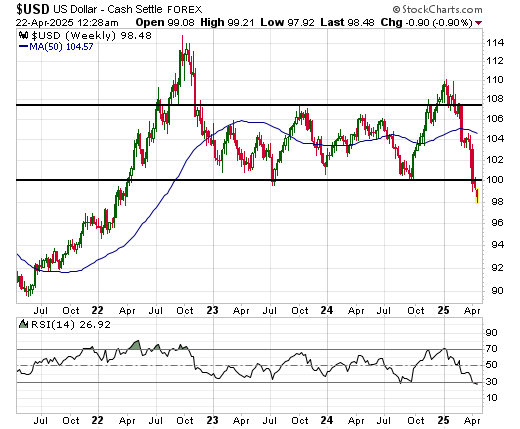
Think back to how bullish almost everyone was about the US dollar’s prospects at the start of this year. Also recall that our view at the time was that the Dollar Index (DX) was set to make a very important peak in January-2025, after which it would trend downward for at least a year. Actually, our view going into this year was that the DX had commenced a cyclical decline in September-2022 and would resume its cyclical decline in January-2025. The fact that it recently made a new cycle low confirms that the DX has, indeed, been in a cyclical bear market since September of 2022 and that the strong rally from the September-2024 low was nothing more than a countertrend move. So, what now?

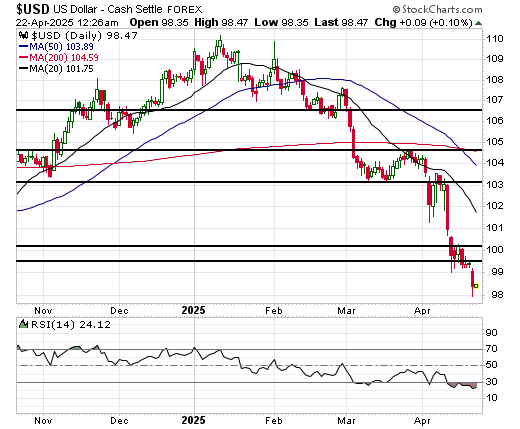
Before attempting to answer the above question, we present herewith a daily chart and a weekly chart of the DX. The daily chart shows the virtual crash of the past two weeks, while the weekly chart shows that the DX has broken below its July-2023 low and is at its lowest level since April of 2022. Both charts show that the DX is extremely oversold.

USD_daily_210425

USD_weekly_210425

Due in part to the performance of the US$ gold price, we doubt that the DX’s cyclical decline is complete. This is because on an intermediate-term basis the gold market does not react to trends in the US dollar’s exchange rate, it projects them. For example, gold’s strength last year projected future US$ weakness against other currencies. The fact that the US$ gold price has just made a new all-time high projects future weakness in the DX.

The way that the DX’s true fundamentals are expected to evolve over the months ahead (they are expected to remain bearish) and the paths taken by the DX following comparable highs in September-2022 and January-2017 also point to additional downside.

However, thanks to the recent collapse it’s likely that the bulk of the decline is in the past.

We have had and continue to have the mid-90s in mind as a target for the DX’s ultimate cycle low. This target may have seemed unreasonably bearish a few months ago, but it is only a few points below the current level. At the same time, a countertrend rebound could result in the DX returning to the 104-105 range.

Further to the above, we are now short-term and intermediate-term neutral on the DX. The ultimate cycle low probably won’t be set until the final few months of this year, but the rebound potential is now at least as large as the remaining downside potential.

Print This Post Print This Post
Commodity Crash

April 7, 2025

[This blog post is an excerpt from a commentary published at www.speculative-investor.com on 6th April 2024]

The effects on the financial markets of Trump’s 2nd April announcement were similar to, albeit not quite as extreme as, the effects of the COVID lockdowns in March of 2020. Like the COVID lockdowns, what was announced on 2nd April constituted a massive government intervention that will disrupt global commerce and that to some extent came as a shock. Markets obviously were expecting widespread tariffs to be announced, but it is clear by the reaction that many market participants were surprised by the magnitude of the tariffs and/or the arbitrary way in which the tariff rates were determined.

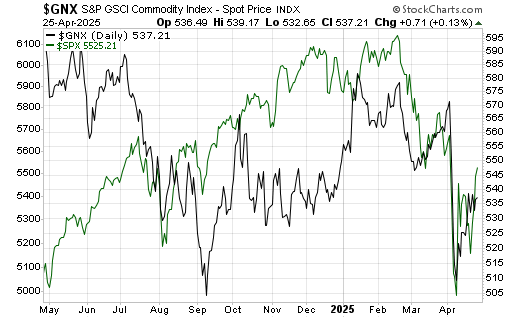
Due to the adverse consequences for global economic growth, commodity prices plunged along with equity prices over the final two trading days of last week. For some industrial commodities the current price levels are not surprising to us in that we expected to see new cycle lows, but what we expected to unfold over the next few months occurred over the space of just two days.

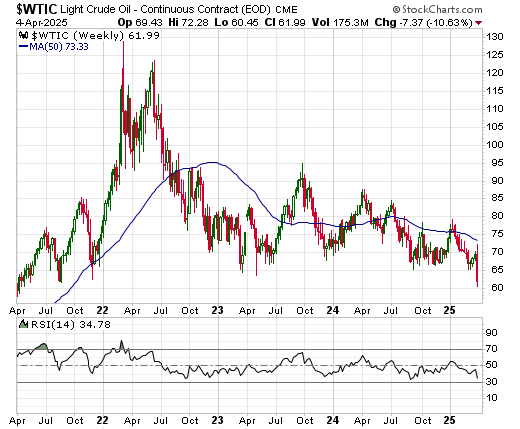
For example, we expected that the rebound in the oil price from its early-March low would be followed by a decline to new cycle (multi-year) lows within the next few months, but the following weekly chart shows that last week the oil price plunged from a 1-month high to its lowest level in almost four years. In oil’s case, the negative reaction to the growth shock that potentially will stem from the tariffs was exacerbated by an OPEC announcement that the first three months of its planned production increases will be lumped together, meaning that OPEC oil production will increase by 411K barrels/day rather than the expected 135K barrels/day next month.

The oil price probably hasn’t bottomed, but by plunging to a new cycle low last week it has done as much as we thought it would do prior to the start of a cyclical upward trend.

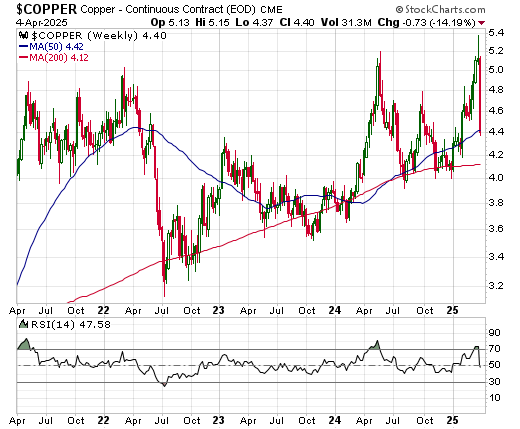
For another example, a week ago we wrote that we perceived a lot of downside risk in the copper price, but we didn’t expect the downside risk to materialise immediately. Instead, the copper price fell 14% last week and removed any doubt that a multi-month price top was set via the spike up to US$5.40 during the preceding week.

The commodity and equity markets reversed course following their lockdown-related crashes in March-April of 2020 due to 1) the extent to which they were stretched to the downside and 2) the upward price pressure exerted by unprecedented monetary intervention. Based on Powell’s words late last week, the Fed is not close to doing anything supportive on the monetary front. Therefore, currently there is no reason to expect anything more bullish than a countertrend rebound.

Print This Post Print This Post

Gold mining stocks versus other mining stocks

April 2, 2025

[This blog post is an excerpt from a commentary published at www.speculative-investor.com last week]

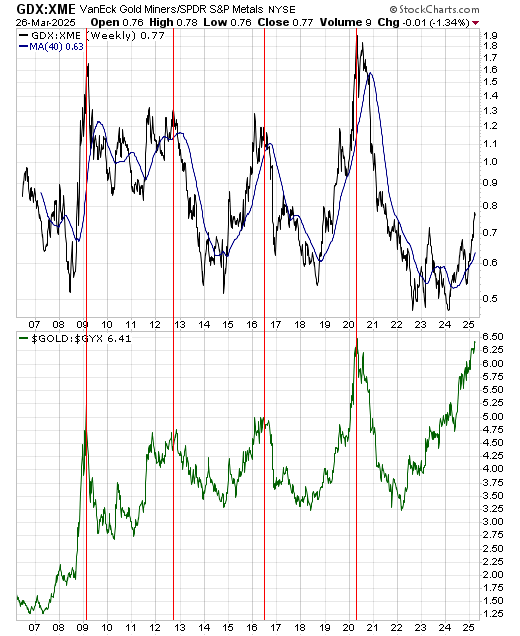
We are revisiting a long-term cycle that we began tracking several years ago. This cycle, which is illustrated by the vertical red lines drawn on the weekly chart displayed below, has been elongated for the same reasons as other cycles/trends over the past couple of years. Before we get to the current situation, a recap is in order.

Over the past two decades, gold mining stocks as represented by GDX have set major peaks relative to general mining stocks as represented by XME approximately every four years, that is, the GDX/XME ratio has tended to make a multi-year peak approximately every four years. Furthermore, the major peaks in the GDX/XME ratio have coincided with major peaks in the gold/GYX ratio (the US$ gold price relative to the Industrial Metals Index), which, in turn, have coincided with the crescendo of an economic or debt crisis. To be specific, the Q1-2009 peak was linked to the Global Financial Crisis, the Q1-2012 peak was linked to the euro-zone sovereign debt crisis, the Q1-2016 peak was linked to the shale oil bust in the US and the general bust in industrial commodity-related investment, and the April-2020 peak was linked to the COVID lockdowns.

The continuation of the 4-year cycle would have led to major peaks in the GDX/XME ratio and the gold/GYX ratio last year. However, this didn’t happen. There was a substantial rise in the gold/GYX ratio, but the GDX/XME ratio did little more than ‘chop around’ near its cycle low.

This prompted us to conclude, in the 23rd September 2024 Weekly Update:

Either the GDX/XME ratio is going to peak at a much lower level during the current cycle than it ever has in the past, or the current cycle has been elongated and is still a long way from its completion.

The latter possibility is the more plausible. The main reason is that the GDX/XME ratio is driven by the gold/GYX ratio, and as noted above past peaks in the gold/GYX ratio have coincided with the crescendo of an economic crisis or a debt crisis.

Mainly because of aggressive government deficit spending designed to postpone a recession, but also because of Fed/Treasury actions that have boosted financial market liquidity in the face of tightening monetary conditions, there has been nothing resembling an economic/debt crisis during the current cycle to date. The crisis has, we think, been shifted from 2024 to 2025 or perhaps even later. Consequently, the cycle top in the GDX/XME ratio that was ‘due’ to occur this year probably won’t occur any sooner than H2-2025.

An implication of the above is that it will make sense to favour gold mining stocks over other mining stocks for at least another 12 months.

Turning to the current situation, since late last year there has been a significant increase in the GDX/XME ratio (shown in the top section of the following chart), while the gold/GYX ratio (shown in the bottom section of the following chart) has continued its strong upward trend. GDX/XME is now at its highest level since mid-2021.

Despite its meaningful increase over the past three months, the chart suggests that there is plenty of scope for additional relative strength by the gold sector. We are referring to the fact that over the past two decades the GDX/XME ratio has never made a cycle peak below 1.2, which is more than 50% above the current level.

We expect that both the GDX/XME ratio and the gold/GYX ratio will make their cycle peaks this year, but those peaks probably aren’t in place and in the case of GDX/XME the peak could be a long way above today’s level.

Print This Post Print This Post