Print This Post Print This Post

A yield curve failure?

September 13, 2024

The US yield curve is considered to be a good leading indicator of US recession, with an inversion of the curve invariably occurring prior to the start of a recession. However, the Wolf Street article posted HERE questions the yield curve’s reliability. The article notes that part of the US yield curve recently ‘uninverted’, which is true. What’s not true is the claim in the article that since 1998 the US yield curve failed twice by warning of recessions that didn’t occur.

According to the article, the yield curve’s 2019 inversion was a failure because even though there was a recession in 2020, the recession was the result of a pandemic and not a business cycle downturn. This is strange reasoning, to put it mildly.

The only way that you could argue logically that the yield curve’s 2019 inversion was a failure would be if you could re-run history to show that in the absence of the COVID pandemic there would not have been a recession. Since this is not possible, the 2019 inversion should not be viewed as a failure. Either it was a success or it should not be counted.

Also according to the article, there was a yield curve inversion in 1998 that was not followed by a recession.

The problem here stems from interpreting a multi-day spike into inversion territory as a recession signal. This problem goes away if you base your analysis on monthly closing or monthly average prices, which generally is what should be done with long-term indicators.

Here is a monthly chart showing that since the late-1960s every inversion of the US 10year-3month yield spread was followed by a recession. Consequently, if this cycle’s yield curve inversion does not lead to a recession then it will be the first failure of this type (the first false positive) in more than 50 years. Note, though, that the monthly chart of the 10year-3month yield spread shows that there was no yield curve inversion prior to the 1990 recession, so this could be viewed as a false negative.

yieldcurve_120924

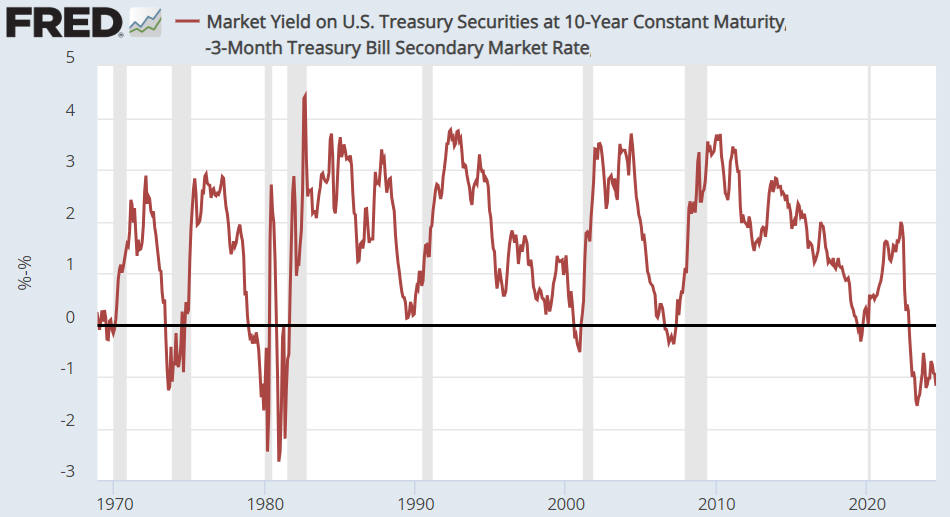
Regardless of whether or not this cycle’s yield curve inversion leads to a recession, a yield curve inversion/uninversion clearly isn’t a useful trading signal. The time between the warning signal and the projected outcome is simply too long and too variable.

Print This Post Print This Post

The ‘real’ gold price is at long-term resistance

September 4, 2024

There are many problems with the calculation methodology of the Consumer Price Index (CPI) and with the whole concept of coming up with a single number to represent the purchasing power of money. Interestingly, however, if we calculate the inflation-adjusted (‘real’) gold price by dividing the nominal US$ gold price by the US CPI, which is what we have done on the following monthly chart, we see that the result has peaked at around the same level multiple times over the past 50 years and that the current value is around this level. Does this imply that gold’s upside is capped?

It adds to the reasons that we should be cautious about gold’s short-term prospects. These reasons include the size of the speculator net-long position in gold futures, the August-September cyclical turning-point window for the gold mining sector, the likelihood of a reduced pace of US federal government spending during the months following the November-2024 election, the fact that gold’s true fundamentals are not definitively bullish, the high level of the gold/GNX ratio (gold is expensive relative to commodities in general), the extent to which the financial markets have discounted Fed rate cuts (four 0.25% Fed rate cuts are priced-in for 2024, creating the potential for a negative surprise from the Fed), and the high combined value of gold and the S&P500 Index relative to the US money supply. However, we expect that within the next 12 months the gold/CPI ratio will move well into new high territory, mainly because:

1) The US economy finally will enter the recession that has been anticipated for almost two years and that has been delayed by aggressive government spending, leading to efforts by both the Federal Reserve and the federal government to stimulate economic activity.

2) Despite the rise in government bond yields over the past few years, it is clear that neither of the major US political parties nor their presidential candidates have any concern about the level of federal government indebtedness. Putting it another way, currently there is no political will to reduce government spending. On the contrary, both presidential candidates are going down the well-worn path of trying to buy the votes of influential groups while ‘turning a blind eye’ to the government’s debts and deficits.

3) Using our own method of adjusting for the effects of inflation*, which generally will not be accurate in the short-term but should be approximately correct over periods of several years or more, the current ‘real’ gold price is a long way below its 1980 and 2011 highs (our method indicates inflation-adjusted highs of around US$5000/oz in 1980 and US$3400/oz in 2011). Refer to the following monthly chart for more detail.

So, while the proximity of the gold/CPI ratio to its long-term resistance adds to the short-term risk, this resistance probably won’t act as a ceiling for much longer.

*The theory that we apply can be summarised as follows: The percentage reduction in a currency’s purchasing power should, over the long-term, be roughly equal to the percentage increase in its supply minus the percentage increase in the combination of population and productivity.

Print This Post Print This Post