Print This Post Print This Post

Gold and ‘real’ US interest rates

August 31, 2023

[This blog post is an excerpt from a commentary published at speculative-investor.com on 27th August 2023]

We’ve noted in previous commentaries how well the US$ gold price has held up given the rise in real US interest rates as indicated by the 10-year Treasury Inflation Protected Securities (TIPS) yield. We are referring to the fact that the 10-year TIPS yield, a long-term chart of which is displayed below, made a 14-year high of 2.00% early last week before pulling back a little, whereas the US$ gold price has retraced less than half of its up-move from its Q4-2022 low. We often say that everything is linked, and in this case the likely linkage (the explanation for gold’s resilience) is the nature of the recent T-Bond sell-off.
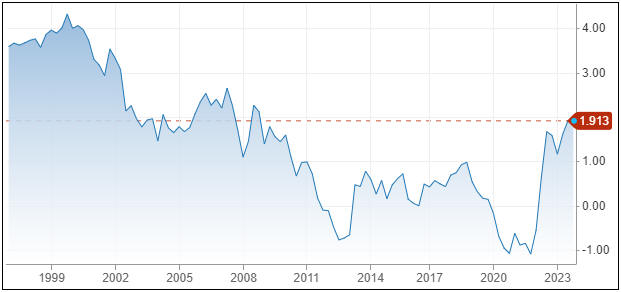

Chart Source: https://www.cnbc.com/quotes/US10YTIP

As discussed in last week’s Interim Update, meaningful declines in the T-Bond price over the past few decades generally have been driven by rising inflation expectations and/or the Fed’s rate-hiking. They generally have NOT been driven by accelerating supply growth or concerns about the same. The main reason is that in the past the T-Bond supply tended to ramp up in parallel with economic and financial market conditions that prompted a substantial increase in the desire to hold T-Bonds, so much so that the increase in demand for the perceived safety provided by Treasury debt trumped the increase in the supply of this debt.

The recent past has been different, in that the decline in the T-Bond price over the past four months and especially over the past month was not driven by changing expectations regarding inflation or the Fed’s monetary tightening. We know that this is the case because the “inflation” rates factored into the TIPS market (what we sometimes refer to as the “expected CPI”) have been stable, as were the prices of the most relevant Fed Funds Futures contracts prior to the past few days. Instead, the main driver was concerns about the pace at which the supply of government debt will grow over the coming year due to current spending plans, rapidly rising interest expense, and a likely large increase in government deficit-spending after the economy slides into recession. This difference matters to the gold market.

The recent increase in the ‘real’ yield on Treasury bonds has not been as bearish for gold as it normally would be, because the concerns about the US fiscal situation that have been driving the T-Bond price downward and the real T-Bond yield upward also have been boosting the investment demand for gold. We suspect that this is not so much due to the rapid increase in the government’s indebtedness in and of itself, but due to the eventual economic and monetary consequences of the burgeoning government debt.

The eventual economic consequences include slower growth as more resources get used and allocated by the government. A likely monetary consequence is that regardless of what senior members of the Fed currently say and think (they naturally will insist that the Fed is independent), there’s a high probability that the Fed eventually will be called upon to help finance the government.

Print This Post Print This Post

The gold sector is approaching a cycle low

August 15, 2023

It is worth paying close attention when a market trends into a period during which a turning point is likely based on historical cyclicality. The gold mining sector has just entered such a period.

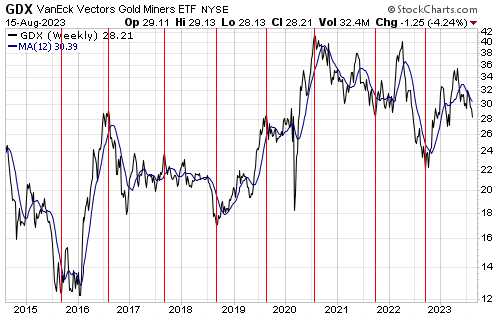
We are referring to the strong tendency of the gold mining sector, as represented by the Gold Miners ETF (GDX), to make its high or its low for the year during August-September. Specifically, this period contained the low for the year in 2015, the high for the year in 2016 and 2017, the low for the year in 2018, the high for the year in 2019 and 2020, and the low for the year in 2021 and 2022. In other words, the August-September period ushered in the annual high or the annual low in each of the past eight years.

The vertical red lines on the following weekly GDX chart mark the aforementioned August-September turning points.

GDX_cycle_150823

We have been following the gold mining sector’s August-September cycle at speculative-investor.com for several years now. At the start of a year there will be no way of knowing whether that year’s August-September period will contain an important high or low, but there usually will be clues by June. By mid-June of this year it was apparent that if the August-September cycle was still in effect then it would mark an important low, that is, a turn from down to up. Subsequent price action has continued to point to an August-September low.

The 12-month cycle low could be set at any time over the next few weeks, but to create maximum potential for the ensuing rally it ideally will be set after the March-2023 low has been tested or breached.

Print This Post Print This Post

An end to the US monetary inflation decline?

August 2, 2023

[This blog post is an excerpt from a commentary published at speculative-investor.com last week]

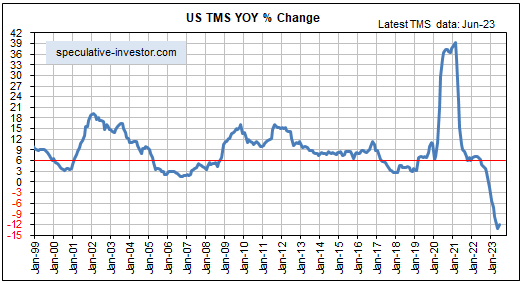
The year-over-year rate of growth in US True Money Supply (TMS) ticked upward in June, that is, the US money supply contracted at a slightly slower pace during the latest month for which there are monetary data. Although the uptick is barely noticeable on the following chart, it is probably significant. It is the first increase in the monetary inflation rate since March-2022 and probably marks an end to the decline.

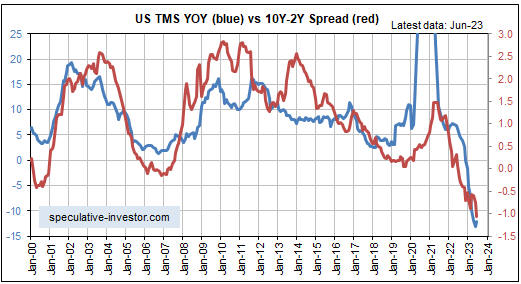
Below is our chart comparing the US monetary inflation rate (the blue line) with the 10y-2y yield spread (the red line), a proxy for the US yield curve. The monetary inflation rate drives the yield curve, so if the monetary inflation rate has begun to trend upward then the yield curve should commence a steepening trend within the next couple of months.

Both the monetary inflation rate and the yield curve may have reached their negative extremes, but unless one of two things happens the US will experience monetary deflation and the yield curve will remain inverted until at least the end of this year. This is because even if the Fed has made its final rate hike, it plans to continue its Quantitative Tightening (QT) for many months to come.

Continuing the QT program at the current rate would remove about $380B from the money supply over the remainder of this year. Although this could be offset by commercial bank lending (commercial banks create new money when they make loans), trends in the commercial banking industry currently are heading in the opposite direction, that is, banks are becoming less willing to expand credit.

One of the two things that could shift the monetary trend from deflation to inflation over the next several months is the large-scale exodus of money from the Fed’s Reverse Repo (RRP) facility. There is still about $1.7 trillion ‘sequestered’ in this facility, which means that there is the potential for up to $1.7T to be released from RRPs to the economy’s money supply.

The other development that could return the US money supply to inflation mode is a crisis that not only stops the Fed’s QT, but also precipitates a new bout of QE.

Our expectation is that there will not be a genuine crisis between now and the end of this year, but that there will be sufficient weakness in the stock market to prompt the Fed to end QT and that at least $1T will come out of the RRP facility to take advantage of the higher rates being offered by Treasury bills. This combination probably would turn the US monetary inflation rate positive by year-end and set in motion a steepening trend in the US yield curve.

Print This Post Print This Post