Print This Post Print This Post

US monetary inflation and the boom-bust cycle

March 28, 2022

[This blog post is an excerpt from a recent TSI commentary]

The phenomenal rise in the US monetary inflation rate from early-2020 to early-2021 fuelled a speculative mania in the stock market and set in motion an economic boom, while the subsequent plunge in the monetary inflation rate will lead to an equity bear market and an economic bust. A lot of speculation has been wrung-out of the stock market in parallel with the plunge in the pace of new money creation, but there remains some doubt as to whether or not the economic boom is over.

Just to recap, a boom is a surge in economic activity, involving both consumption and investing, in response to price signals caused by monetary inflation. It fosters the impression that great economic progress is being made, but most of the apparent gains achieved during the boom will prove to be ephemeral because the underlying price signals are false/misleading. It will turn out that there are insufficient resources (labour and materials) to complete projects and/or that resources cost a lot more than planned and/or that the consumption forecasts upon which business additions/expansions were based were far too optimistic. The realisation, stemming from rising costs and lower-than-forecast cash flows, that many of the investments made during the boom years were ill-conceived sets in motion the bust phase of the cycle. During the bust phase, boom-time investments get liquidated.

The economic bust will be ‘explained’ by Keynesians* as a collapse in aggregate demand stemming from a mysterious collapse in confidence (“animal spirits”) and will prompt policies aimed at creating a new boom (a new batch of false price signals upon which future investing mistakes will be based), thus perpetuating the cycle.

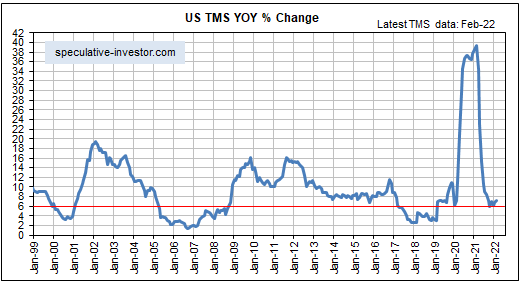
As mentioned above, there remains some doubt as to whether or not the latest US economic boom is over. Some indicators say it is, while others are yet to confirm. Also, although the monetary inflation rate has crashed from its February-2021 high, the following monthly chart shows that it is still slightly above the boom-bust threshold of 6%**.

We defined the threshold based on the historical record, in that over the past few decades a boom-to-bust transition for the US economy didn’t begin until after the monetary inflation rate dropped below 6%. However, due to the structural damage to the economy resulting from the Fed’s manipulations of money and interest rates over many decades and especially over the past decade, it’s possible that a bust will begin with the monetary inflation rate at a higher level than in the past.

In any case, the monetary inflation rate should never be used for timing purposes. There are other measures, such as credit spreads, that signal when the monetary inflation rate has risen far enough to set in motion a boom or fallen far enough to set in motion a bust. These measures suggest that the US economy is now in the early part of a bust, although the evidence is not yet conclusive.
*All senior central bankers and most politicians are Keynesians.

**Due to tough year-over-year comparisons, we thought that the US monetary inflation rate (the year-over-year rate of growth of the True Money Supply) would drop below 6% during the first two months of this year. The reason it didn’t is that more than $800B was added to the money supply over the course of those months. The 2-month money-supply surge to begin 2022 was due to a reduction in the Fed’s reverse repo program (this put about $300B back into circulation), an increase in commercial bank credit (this created about $240B of new money), Fed monetisation of securities (this created about $150B of new money) and, we suspect, the flight of some money to the US to escape the troubles in Europe.

Print This Post Print This Post

A major stock market peak in hard currency terms

March 22, 2022

[This blog post is an excerpt from a recent commentary published at TSI]

Gold is inherently a stronger currency than the US$. This is because the total supply of gold increases by about 1.5% every year, whereas the total supply of US dollars seldom grows at a rate of less than 4% per year and periodically experiences double-digit annual percentage growth. As a result, the US stock market should peak in gold terms well before it peaks in US$ terms, which is exactly what has happened in the past.

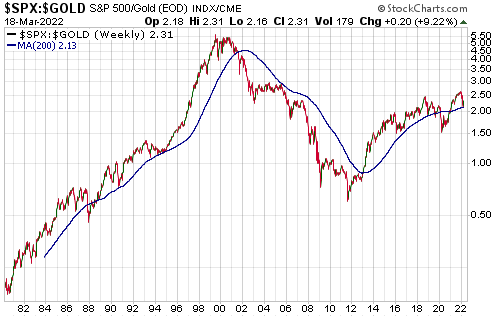
The following weekly chart shows the S&P500 Index in gold terms since 1980. With regard to the past 25 years, the two peaks that stand out on this chart occurred in September-2018 and July-1999. In the first case, the peak in the SPX/gold ratio preceded the SPX’s nominal dollar peak by about 16 months (the SPX didn’t peak in dollar terms until February-2020). In the second case, the peak in the SPX/gold ratio preceded the SPX’s nominal dollar peak by about 8 months (the SPX peaked in dollar terms in March-2000).

The most recent peak in the SPX/gold ratio occurred at the beginning of December-2021. Based on what’s happening on the monetary and economic fronts, we think that this will turn out to be a major top (a top that holds for at least 3 years). At this stage, however, what we have is a pullback to the 200-week MA, which would be consistent with either an intermediate-term correction within an on-going major upward trend or the first leg of a new major downward trend.

The point we want to make today is that even if the decline over the past three months of the SPX/gold ratio was the first leg of a new major downward trend (the most likely scenario, in our opinion), it would not be out of the ordinary for the SPX to make a new all-time high in dollar terms during the second half of this year or the first half of 2023.

Print This Post Print This Post

The shift from boom to bust may have begun

March 8, 2022

[This blog post is an excerpt from a commentary published at TSI on 6th March 2022]

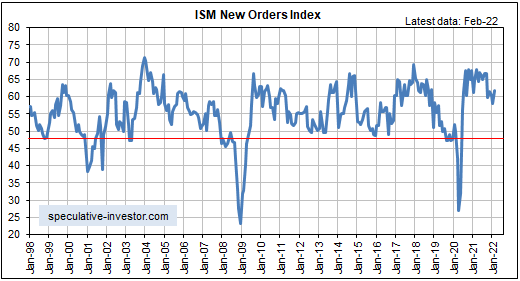
The latest leading economic data indicate that the US expansion is intact. This is the case even though the following monthly chart reveals that the ISM Manufacturing New Orders Index (NOI), one of our favourite leading economic indicators, has been working its way downward since hitting a cycle peak about 12 months ago. The reason is that it’s normal for the rate of improvement — which is what the NOI is measuring — to decline while the economy remains in the expansion phase. That being said, we’ve noted over the past two months that the pace of US economic activity is set to slow markedly during the first half of this year.

We wrote a month ago that due to “inflation” remaining near its cycle peak while the pace of economic activity slows, the ‘real’ GDP growth rate during the first quarter of this year could be close to zero. That was before Russia attacked Ukraine and the West imposed severe economic sanctions on Russia, causing additional large increases in commodity prices. As a result of these price increases, the official “inflation” statistics such as the CPI will be higher for longer and calculations of ‘real’ growth will be lower. This could well mean that the headline US GDP growth numbers will be negative in both Q1-2022 and Q2-2022.

Note that a sign of the downward pressure on economic activity resulting from high inflation is the decline in ‘real’ wages. The monthly US Employment Report issued on Friday 4th March contained an estimate that hourly earnings had increased by 5.1% year-over-year in nominal dollar terms. While this is high compared to the average of the past two decades, it’s likely that the cost of living increased by 8%-12% over the same period. This implies that real hourly earnings have fallen by at least a few percent over the past 12 months.

Will the Powell-led Fed make a series of rate hikes in the face of a shrinking economy in response to price rises that are due to supply disruptions? We don’t think so. A Volcker-led Fed would have begun hiking interest rates long ago, but “Mississippi Jay” is the most dovish Fed chairman ever. The Fed almost certainly will make a 0.25% rate hike this month, but we continue to suspect that it will then go on hold for the remainder of the year.

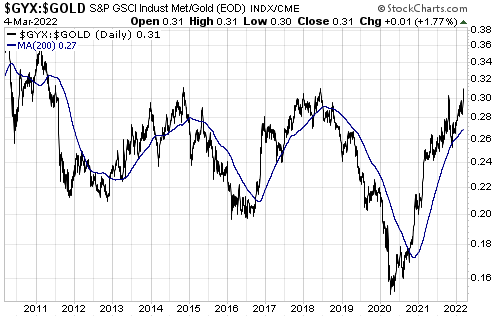
At this stage the leading recession indicators we follow do NOT point to a recession beginning within the next six months (two quarters of negative GDP growth can occur in the absence of a recession), but there’s now a high probability that a boom-to-bust transition will begin during the first half of this year. The recent widening of credit spreads is warning that this is the case, but to confirm a boom-to-bust transition the credit-spread widening will have to be joined by a downward trend reversal in the GYX/gold ratio (the Industrial Metals Index relative to the US$ gold price) and/or a downward trend reversal in the 2-year T-Note yield. The chart displayed below shows that the GYX/gold ratio ended last week at a multi-year high and near the level at which it peaked in 2014 and 2018.

As noted in previous TSI commentaries, the start of a boom-to-bust transition usually precedes the start of an official recession by at least a few quarters.

Print This Post Print This Post