Print This Post Print This Post

When will rising interest rates become a major problem for the stock market?

March 22, 2021

[This blog post is an excerpt from a recent TSI commentary]

The title of this discussion is a trick question. The reason is that while rising interest rates put downward pressure on some stock market sectors during some periods, it is not clear that rising interest rates bring about major, broad-based stock market declines. After all, the secular equity bull market that began in the early-to-mid 1940s and ended in the mid-to-late 1960s unfolded in parallel with a rising interest-rate trend.

The conventional wisdom that rising interest rates eventually become a major problem for the stock market exists for two inter-related reasons. First, there is a strong tendency for major equity market declines to be preceded by a sustained and substantial tightening of monetary conditions. Second, it is common for a substantial tightening of monetary conditions to be accompanied by rising interest rates.

However, a sustained and substantial tightening of monetary conditions would bring about major weakness in the stock market even if interest rates were low or falling. This, in essence, is what happened during 2007-2008. The corollary is that a rising interest-rate trend would never become a major problem for the overall stock market as long as monetary conditions remained sufficiently accommodative.

The point is that when assessing the prospects of the stock market we should be more concerned about monetary conditions than interest rates, because it isn’t a given that rising interest rates indicate tightening monetary conditions or that falling interest rates indicate loosening monetary conditions. How, then, do we know the extent to which monetary conditions are tight or loose?

One of the most important indicators, albeit not the only useful indicator, is the growth rate of the money supply itself.

Good economic theory informs us that rapidly inflating the money supply leads to a period of unsustainable economic vigour called a boom, and that the boom begins to unravel after the monetary inflation rate slows. Over the past 25 years, booms have begun to unravel within 12 months of the year-over-year growth rate of G2 (US plus eurozone) money supply dropping below 6%.

The following chart shows the year-over-year growth rate of G2 True Money Supply (TMS), with a horizontal red line drawn to mark the 6% growth level mentioned above and vertical red lines drawn to mark the official starting times of US recessions. In the typical sequence, there is a decline in the G2 monetary inflation rate below 6%, followed within 12 months by the start of an economic bust (the unravelling of the monetary-inflation-fuelled boom), followed within 12 months by an official recession.
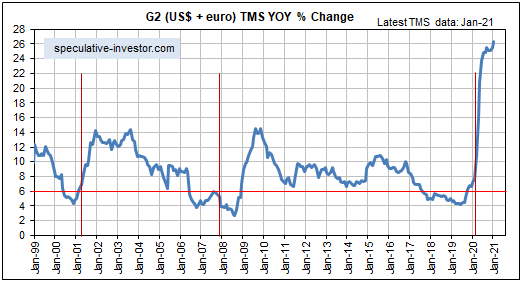
The time from a decline in the G2 monetary inflation rate to below 6% to the start of a recession can be two years or even longer, but the broad stock market tends to struggle from the time that the boom begins to unravel. This typically occurs within 12 months of the monetary inflation rate dropping below 6%, regardless of what’s happening with interest rates.

Now, it’s likely that the unravelling of the current boom will begin with the monetary inflation rate at a higher level than in the past. However, with the G2 TMS growth rate well into all-time high territory and still trending upward it is too soon (to put it mildly) to start preparing for an equity bear market.

Print This Post Print This Post

Gold: Supportive sentiment and bearish fundamentals

March 17, 2021

For the first time in a long time, the sentiment backdrop recently became supportive for the gold price. However, the true fundamentals have been trending in a gold-bearish direction since early-October of last year (after having been supportive for almost a year before that) and still constitute a headwind for the gold price.

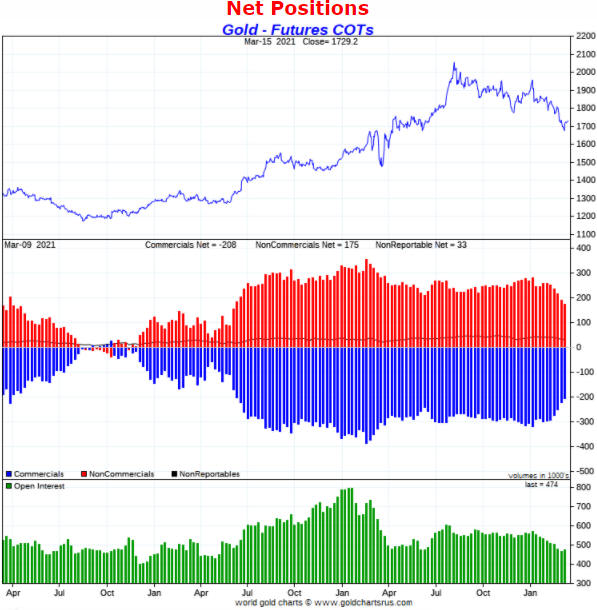
When it comes to assessing gold market sentiment, the Commitments of Traders (COT) report provides by far the most useful data. This is because it shows what speculators, as a group, are doing with their money in the part of the market (Comex futures) that is subject to the greatest sentiment swings and that has the greatest effect on short-term price movements.

At the moment, the total speculative net-long position (the inverse of the blue bars shown in the middle section of the following chart) is at its lowest level since June-2019. This implies that speculators are now less interested in gold than at any time over the past 20 months. Of greater importance is that the open interest (the green bars shown in the bottom section of the chart) is not far from its lows of the past three years. This is important because the gold price tends to bottom when the futures market open interest is relatively low.

goldCOT_blog_170321
Chart source: http://www.goldchartsrus.com/

The COT situation tells us that speculator enthusiasm for gold is now at a low ebb relative to the past couple of years, which is bullish given that speculator sentiment is a contrary indicator. At the same time, though, the fundamental backdrop remains bearish.

In broad-brush terms, the fundamental backdrop is bearish for gold when confidence in the economy and the financial system is high or increasing and bullish for gold when confidence in the economy and the financial system is low or decreasing. Confidence may seem like a vague concept, but it can be quantified using interest-rate spreads, price ratios and other market data.

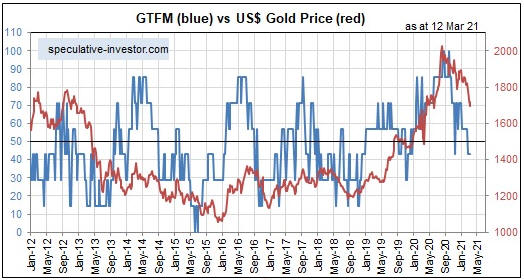
The Gold True Fundamentals Model (GTFM), a weekly chart of which is displayed below, is my attempt to quantify the fundamentals that matter to the gold market.

GTFM_blog_170321

When the fundamental backdrop is gold-bearish the best that can be reasonably expected from the gold price is a multi-week countertrend rebound, even when the sentiment situation is supportive. That appears to be what’s happening at the moment.

I expect that the fundamentals will turn in gold’s favour within the next three months as the US economy and many other economies around the world begin to shift from strong economic rebound to “stagflation”. However, they haven’t turned yet.

Print This Post Print This Post
The US economy is well into the boom phase

March 8, 2021

[Below is an excerpt from a commentary published at TSI last week. It is our latest monthly review of the short and intermediate term prospects of the US economy. Just to be clear, a boom is defined as a period during which monetary inflation and the suppression of interest rates create the FALSE impression of a strong/healthy economy.]

We think that last year’s US recession ended in June plus/minus one month, making it the shortest recession in US history. The latest data indicate that the recovery is well and truly intact.

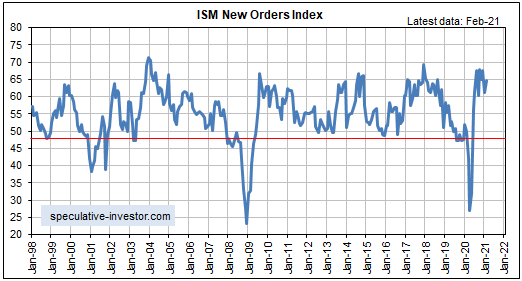
Of particular relevance, the following monthly chart shows that the ISM New Orders Index (NOI), one of our favourite leading economic indicators, remains near the top of its 20-year range following a pullback in January-2021 and a rise in February-2021.

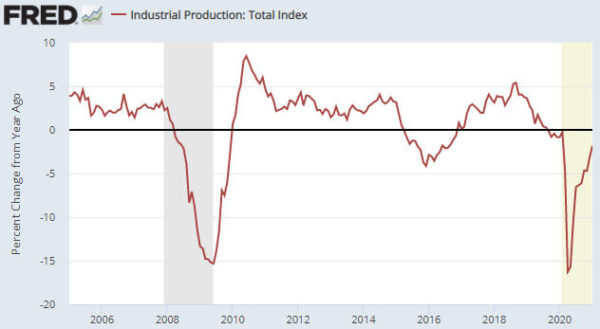
The ISM NOI leads Industrial Production (IP), so it isn’t surprising that the year-over-year percentage change in IP has experienced a rapid rebound from its Q2-2020 trough (refer to the following monthly chart for the details). More importantly, based on the latest NOI number, other leading indicators and the inevitability of additional stimulus from both the Fed and the government, IP’s rebound is set to continue. The IP number for March-2021 will (not might) indicate year-over-year growth.

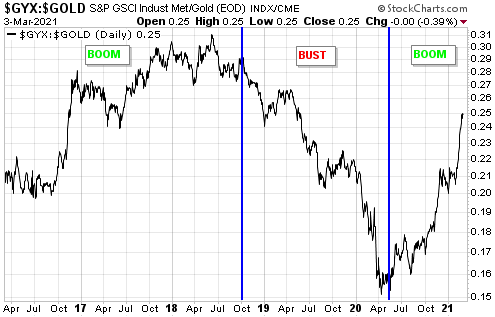
The performances of leading and coincident economic indicators show that we are well into the boom phase of the boom-bust cycle, meaning that the economic landscape remains bullish for industrial commodities and bearish for gold. Therefore, it’s reasonable to expect the continuation of the rising trend in the GYX/gold ratio (industrial metals relative to gold) clearly evident on the following chart. Be aware, though, that on a short-term basis this trend appears to be over-extended.

The economic strength that was predicted eight months ago by leading indicators and is starting to become apparent in coincident indicators is largely artificial. This means that it will evaporate soon after the Fed is forced by blatant evidence of an inflation problem to end the monetary stimulus.

Our thinking at this time is that the period of strong economic growth will be followed by a period of what is often called “stagflation”, that is, a period when “inflation” accelerates in parallel with slow or no economic growth, because the Fed is not going to stop creating new money at a fast pace and the US government is not going to stop spending at a fast pace anytime soon. If so, then during the post-boom period commodities could continue to do well but gold should outperform almost everything.

However, we’ve learned from bitter experience that during the boom it’s best NOT to look ahead to the inevitable economic denouement. Instead, the focus should be on “making hay while the sun shines”. Near the end of the boom there will be timely warnings in the real-time data, but at the moment such warnings are conspicuous by their absence. This means that the boom should continue for at least another three months and could continue for much longer than that.

Print This Post Print This Post
Gold and the Boom-Bust Cycle

March 1, 2021

[This blog post is a modified excerpt from a commentary published at TSI on 21st February]

The true fundamentals* have been trending in a gold-bearish direction since early-October of last year, which is a large part of the reason that the gold price has been in a downward trend for the past several months. The majority of these true fundamentals are measures of confidence in the economy and/or the banking system, the theory — which is supported by decades of empirical evidence — being that gold performs relatively well in the bust phase of the boom-bust cycle and relatively poorly in the cycle’s boom phase.

Just to be clear, if the US$ is weak enough then it certainly is possible to make gains in US$ terms via being long gold during a boom, but you will do better by being long other things including industrial commodities. Hence the use, above, of the word “relatively”.

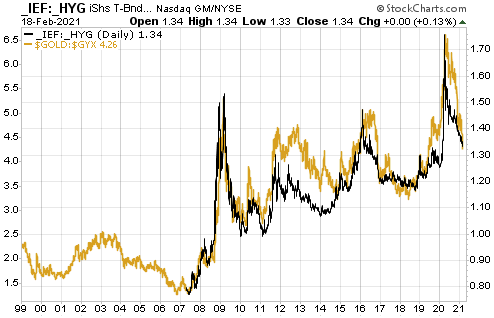
Credit spreads are one useful measure of economic confidence, with widening spreads indicating falling confidence and narrowing spreads indicating rising confidence. This implies that the direction and level of credit spreads indicate whether the economy is in the boom phase or the bust phase. That’s why the gold/commodity ratio generally has trended up and down with credit spreads, which is exactly what it should do.

Below is a chart that illustrates the relationship mentioned above. In this case metals are being compared with metals by looking at how gold performed relative to industrial metals (represented by the Industrial Metals Index – GYX) during periods of widening and narrowing credit spreads.

Unfortunately, the data for the credit spread indicator used in this chart starts in 2007, so for the first eight years of the chart there is only the gold/GYX ratio. However, a longer-term credit-spread indicator would confirm that gold/GYX’s 2001-2002 upward trend coincided with an economic bust and gold/GYX’s 2003-2006 downward trend coincided with an economic boom.

The chart suggests that there was a major economic boom during 2003-2006 and major economic busts spanning mid-2007 to mid-2009 and Q4-2018 to March-2020. The period from mid-2009 through to Q3-2018 contained a series a relatively minor booms and busts.

My guess is that the current boom will be short by historical standards, but there is no need to guess correctly because real-time data will provide timely warnings that the transition from boom to bust has begun. Right now there is no evidence that the boom is over.

*I use the term “true fundamentals” to distinguish the actual fundamental drivers of the gold price from the drivers that are regularly cited by gold-market analysts and commentators. According to many pontificators on the gold market, gold’s fundamentals include the volume of metal flowing into and out of the inventories of gold ETFs, China’s gold imports, the volume of gold being transferred out of the Shanghai Futures Exchange inventory, the amount of “registered” gold at the COMEX, India’s monsoon and wedding seasons, jewellery demand, the amount of gold being bought/sold by various central banks, changes in mine production and scrap supply, and various manipulation stories including wild guesses regarding JP Morgan’s exposure to gold. These aren’t true fundamental price drivers. They are distractions (at best) and should be ignored.

Print This Post Print This Post