Print This Post Print This Post

Rising fear of inflation

January 26, 2021

[This post is an excerpt from a commentary published at TSI on 17th January 2021]

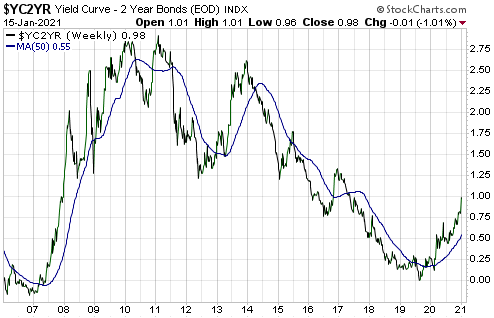
The US yield curve, represented on the following weekly chart by the spread between the 10-year T-Note yield and the 2-year T-Note yield, has been steepening since the third quarter of 2019. Moreover, the pace of the steepening is accelerating.

yieldcurve_blog_260121

A steepening of the yield curve can be primarily driven by decreasing yields on short-dated treasuries or increasing yields on long-dated treasuries. The former results from a general increase in the desire to hold the most liquid and lowest-risk financial assets, such as cash and T-Bills. It is bullish for gold and bearish for commodities and most equity sectors. The latter results from a general increase in inflation expectations. It is also bullish for gold but is more bullish for commodities and certain equity sectors.

The steepening that occurred from the third quarter of 2019 through the first half of 2020 was driven by declining yields on short-dated treasuries, but the steepening that has occurred since August-2020 was driven by rising yields on long-dated treasuries, that is, by rising inflation expectations.

Given what the US government and the Fed have done and plan to do, it shouldn’t be a surprise to anyone that inflation expectations are in a rising trend and that the trend is accelerating. Of particular significance, President-elect Biden has proposed a new “stimulus” package with a US$1.9 trillion price tag, and it is well known that this spending package will be followed by an infrastructure bill that probably will involve another $1-$2 trillion of additional spending. Also, we have statements from the Fed to the effect that now is not the time to be talking about reducing the monetary accommodation and that there won’t be any tightening until an inflation problem is obvious to all.

The Fed could try to suppress one of the symptoms of a burgeoning inflation problem by attempting to control the yield curve, that is, by ramping-up its purchases of long-dated treasuries with the aim of lowering yields at the long end of the curve. However, that would amount to creating more money out of nothing in an effort to address a problem caused by creating too much money out of nothing. Even by the Fed’s own standards this would be counterproductive.

The bottom line is that there will be a lot more inflation and a further large increase in inflation fear before there is a realistic chance of a deflation scare.

Print This Post Print This Post

Gold versus Bitcoin

January 20, 2021

[This blog post is an excerpt from a TSI commentary published last week]

Does the rapid rise in the bitcoin price and the slide in the gold price over the past several months indicate that bitcoin is sapping demand from gold? The short answer is no, because the performance of gold makes sense without reference to bitcoin. A longer answer requires discussing the major differences between gold and bitcoin.

The differences between gold and bitcoin are far more significant than any similarities. Neither is money in the only practical definition of the term (the general medium of exchange), but gold trades like money. Of particular relevance, the demand to hold money (and therefore gold) tends to rise during ‘busts’ and fall during ‘booms’. A consequence is that gold generally doesn’t do well when the stock market is ‘bubbling’.

Bitcoin, in contrast, trades like an illiquid commodity, because that’s what it is. No money or widely-used currency in history has ever traded the way bitcoin has traded and it’s reasonable to assume that none ever will.

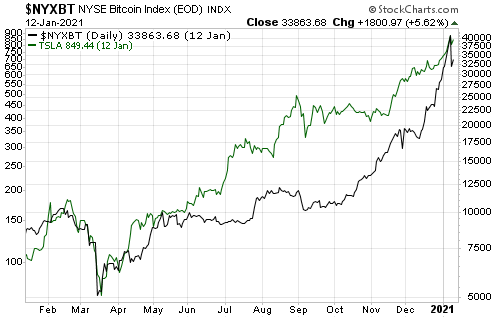
The spectacular rise in the bitcoin price over the past 10 months is related to the bubble that has formed in the stock market and the associated spectacular rises in the stock prices of the companies with which the public has become infatuated. Obviously, Tesla (TSLA) is such a company. The following chart compares the bitcoin price with the Tesla share price.

gold_bitcoin_190121

Bitcoin ‘bubbled with the stock market in 2020. It also ‘bubbled’ with the stock market during 2017 and if it had been around at the time it almost certainly would have ‘bubbled’ with the stock market during 1999-2000, whereas the desire to hold money or gold diminishes when the prices of speculative assets are rocketing upward in real terms. Who wants to own gold when the record of the past 1 year, 5 years and 10 years ‘proves’ that you will do much better by owning QQQ (the NASDAQ100 ETF)?

It’s likely that the gold price will embark on its next intermediate-term advance at around the time that the bitcoin price reaches an important top. That’s not because bitcoin has been draining demand from gold, but because a top for the bitcoin price probably will occur at around the same time as a top for speculation in general and a trough in the desire to hold cash reserves.

We still could be a few months away from a major top for speculation in general, so at this time it is still better to be ‘long’ consumable commodities and speculative assets than to be ‘long’ gold.

Print This Post Print This Post

US Recession/Recovery Watch

January 11, 2021

There are a handful of leading economic indicators that when taken together have provided timely warnings of every US recession and recovery for at least the past sixty years. A monthly feature at TSI is a discussion, primarily based on these indicators but also taking into account expected monetary and fiscal policies, of the prospects for the US economy over the ensuing 6-12 months.

At the end of 2019, before anyone outside Wuhan had heard of the new coronavirus, the leading indicators we track pointed to a 60% probability of the US economy entering recession during the first half of 2020 and an 80% probability of the US economy entering recession before the end of 2020. The only reason the probabilities weren’t even higher was the possibility that the Fed’s money pumping following its 2019 “pivot” would push the recession start into 2021. The lockdowns of March-2020 eliminated any possibility that the inevitable recession would be postponed.

By early-July of 2020 it became clear, based on the same leading indicators, that the recession catalysed by the H1-2020 lockdowns was over. This informed our decision to begin favouring industrial commodities over gold.

It’s important to continue weighing new data and making adjustments in real time as required, but based on what is currently known the probability of the US economy slipping back into recession during the first half of 2021 is extremely low. There is, however, an uncomfortably high probability of the US economy re-entering recession territory during 2022.

Here’s what we wrote in our latest monthly US Recession/Recovery Watch, which was part of a commentary published at TSI last week:

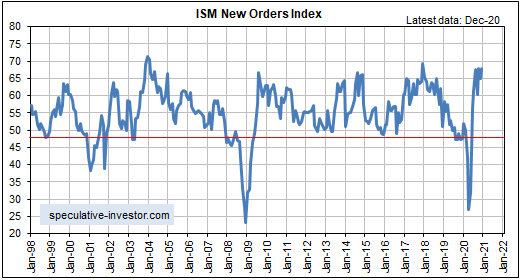
We called an end to the 2020 US recession in early-July of last year, mainly due to the spectacular rise in the ISM New Orders Index (NOI) that had just occurred. This call has been supported by subsequent data and eventually should be confirmed by the National Bureau of Economic Research (NBER)*, making last year’s recession the shortest in US history. The latest ISM data, which were published earlier this week, indicate that the recovery is intact.

The following monthly chart shows that the NOI remains near the top of its 20-year range, meaning that the US economy continues to recover from the devastation caused by the lockdowns directed by the government during the first half of last year.

ISMNOI_blog_110121

Based on the economic and monetary data published over the past couple of months it’s possible that later this month the US government’s statisticians will report annualised nominal GDP growth of at least 10% for Q4-2020 and likely that the US economy will achieve annualised nominal GDP growth of at least 5% during the first half of 2021. Are you long industrial commodity stocks?

The strength is largely artificial and will evaporate soon after the Fed is forced by blatant evidence of an inflation problem to end the monetary stimulus, but that is probably a story for the second half of this year and beyond. Over the next 1-2 quarters it’s a good bet that the monetary tsunami will continue, courtesy of both the Fed and the government. For example, the US federal government has just sent $600 “stimulus” checks to most Americans, but that won’t be the end of it. President-elect Biden wants to send another $2000 to every American and a massive infrastructure spending program is ‘on the cards’.

It’s amazing what the government can do when it stops pretending to care about its own indebtedness and embraces the spirt of Modern Monetary Theory (MMT).

*It can take the NBER, the official arbiter of US recession dates, a year or more to confirm a recession start/end date.

Print This Post Print This Post